. 2014 Dec 9;130(24):2152-61.
doi: 10.1161/CIRCULATIONAHA.114.010775. Epub 2014 Oct 3.

Cardiac remodeling in response to 1 year of intensive endurance training

Affiliations

Cardiac remodeling in response to 1 year of intensive endurance training

Armin Arbab-Zadeh et al. Circulation. .

Abstract

Background: It is unclear whether, and to what extent, the striking cardiac morphological manifestations of endurance athletes are a result of exercise training or a genetically determined characteristic of talented athletes. We hypothesized that prolonged and intensive endurance training in previously sedentary healthy young individuals could induce cardiac remodeling similar to that observed cross-sectionally in elite endurance athletes.

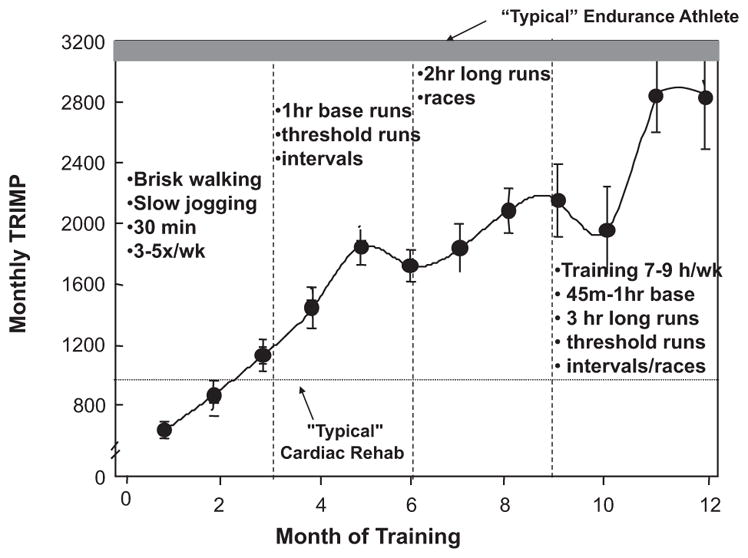
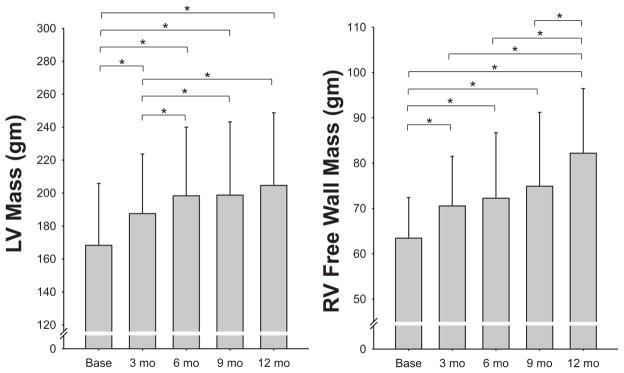
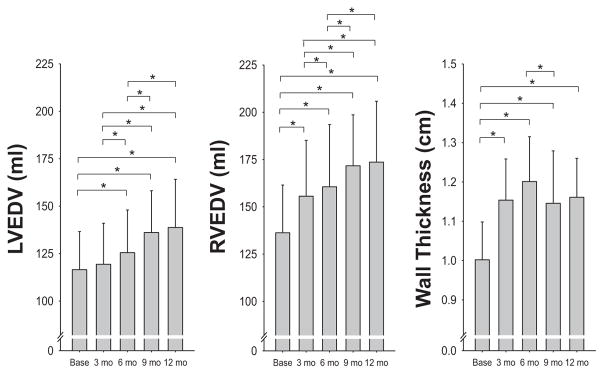
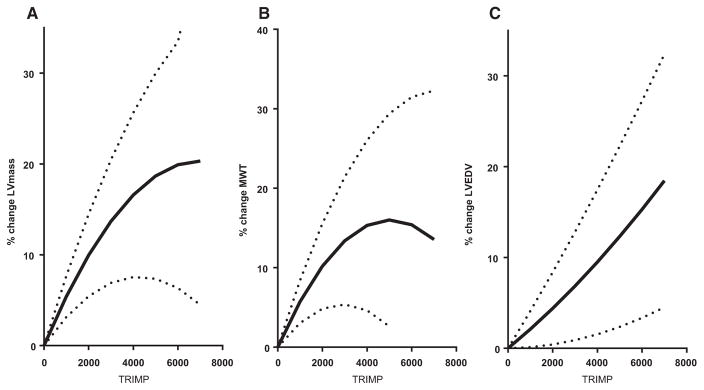
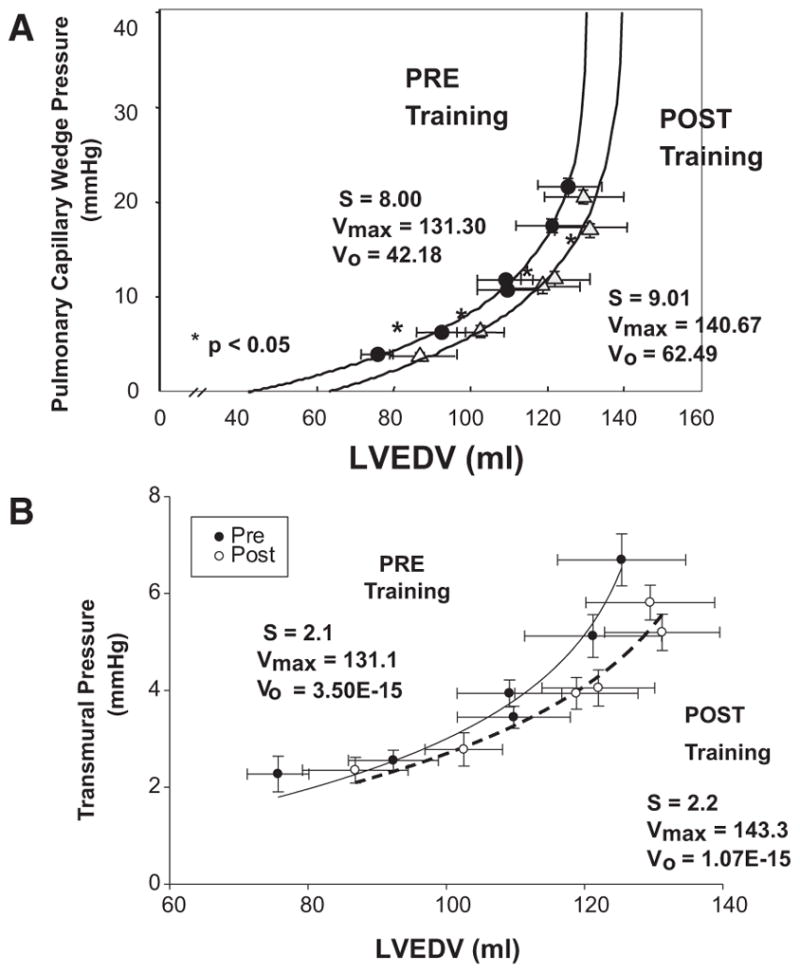
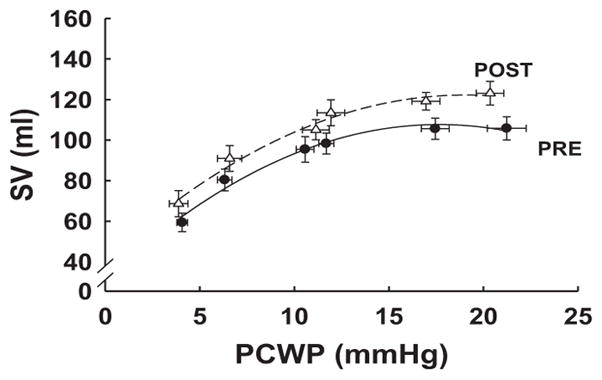
Methods and results: Twelve previously sedentary subjects (aged 29±6 years; 7 men and 5 women) trained progressively and intensively for 12 months such that they could compete in a marathon. Magnetic resonance images for assessment of right and left ventricular mass and volumes were obtained at baseline and after 3, 6, 9, and 12 months of training. Maximum oxygen uptake ( max) and cardiac output at rest and during exercise (C2H2 rebreathing) were measured at the same time periods. Pulmonary artery catheterization was performed before and after 1 year of training, and pressure-volume and Starling curves were constructed during decreases (lower body negative pressure) and increases (saline infusion) in cardiac volume. Mean max rose from 40.3±1.6 to 48.7±2.5 mL/kg per minute after 1 year (P<0.00001), associated with an increase in both maximal cardiac output and stroke volume. Left and right ventricular mass increased progressively with training duration and intensity and reached levels similar to those observed in elite endurance athletes. In contrast, left ventricular volume did not change significantly until 6 months of training, although right ventricular volume increased progressively from the outset; Starling and pressure-volume curves approached but did not match those of elite athletes.

Conclusions: One year of prolonged and intensive endurance training leads to cardiac morphological adaptations in previously sedentary young subjects similar to those observed in elite endurance athletes; however, it is not sufficient to achieve similar levels of cardiac compliance and performance. Contrary to conventional thinking, the left ventricle responds to exercise with initial concentric but not eccentric remodeling during the first 6 to 9 months after commencement of endurance training depending on the duration and intensity of exercise. Thereafter, the left ventricle dilates and restores the baseline mass-to-volume ratio. In contrast, the right ventricle responds to endurance training with eccentric remodeling at all levels of training.

Keywords: exercise; exercise nutrition physiology; hypertrophy.


Figures

Figure 1
Figure 1
Average training impulse (TRIMP) scores per month for all subjects over the training year. Group values are mean±SD. Examples of training workouts are provided in each quarter (vertical dashed line); bottom dotted line represents the average monthly TRIMP that would be accomplished by a subject in a typical cardiac rehabilitation program exercising for 45 minutes at 75% of maximum predicted heart rate 3 times per week; upper bar represents the range of TRIMPs accumulated by typical middle-distance runners as quantified by studies performed in the senior author’s laboratory.,
Figure 2
Figure 2
Changes in left ventricular (LV) mass (left) and right ventricular (RV) mass (right) measured by magnetic resonance imaging every 3 months during the 1-year training program. Mean±SD data (bars) are shown for each time point. Note differences in scale for each graph, with LV mass being ≈2.5 times the RV free wall mass. Overall P value from the linear mixed effects model repeated measures analysis, P<0.001 for each. *Post hoc comparisons for P<0.05. Individual data are reported separately in Figure I in the online-only Data Supplement.
Figure 3
Figure 3
Mean±SD changes in left ventricular end-diastolic volume (LVEDV; left) and right ventricular end-diastolic volume (RVEDV; middle) by magnetic resonance imaging measured every 3 months during the training program. Note that in contrast to Figure 2 comparing LV to RV mass, the scale for LVEDV and RVEDV is the same. Mean wall thickness is shown on the right to facilitate a visual representation of the year-long changes in cardiac morphology. Overall P value from the linear mixed effects model repeated measures analysis, P<0.001 for each. *Post hoc comparisons for P<0.05. Individual data are reported separately in Figure II in the online-only Data Supplement.
Figure 4
Figure 4
Quadratic regression analysis between average quarterly training impulse (TRIMP) values as a measure of training stimulus and left ventricular (LV) mass (left), LV mean wall thickness (MWT; middle), and LV end-diastolic volume (EDV; right). Solid black lines represent the random effect regression that uses all individual data points and models the study participant as a random effect to account for the lack of independence between observations on the same individual; dotted lines represent the 95% confidence limits for this regression. Individual data are reported separately in Figure III in the online-only Data Supplement.
Figure 5
Figure 5
A, Pressure-volume curves representing pulmonary capillary wedge pressure as an index of left ventricular end-diastolic pressure vs left ventricular end-diastolic volume (LVEDV) obtained from 2-dimensional echocardiography over the range of left ventricular filling produced by lower body negative pressure (2 lowest values of pulmonary capillary wedge pressure), quiet baseline (2 middle values of pulmonary capillary wedge pressure), and rapid saline infusion (2 highest values of pulmonary capillary wedge pressure) with modeling of the pressure-volume curves, as described in the text. Each data point represents the mean±SE of all subjects before (filled symbol) and after (open symbol) 1 year of training. S indicates stiffness constant; Vmax, maximum volume obtained by this chamber; and Vo, equilibrium volume. *Statistically significant difference. B, Pressure-volume curves derived as in A but using the difference between pulmonary capillary wedge pressure and right atrial pressure as an index of transmural filling pressure.
Figure 6
Figure 6
Starling curves representing pulmonary capillary wedge pressure (PCWP) as an index of left ventricular end-diastolic pressure vs stroke volume (SV) over range of left ventricular filling produced by lower body negative pressure (2 lowest values of PCWP), quiet baseline (2 middle values of PCWP), and rapid saline infusion (2 highest values of PCWP), as described in the text (before vs after, P<0.0001). Each data point represents the mean±SE of all subjects before (filled symbol) and after (open symbol) 1 year of training.

Comment in

Similar articles

Cited by

References

    1. Levine BD. VO2max: what do we know, and what do we still need to know? J Physiol. 2008;586:25–34. - PMC - PubMed
    1. Mitchell JH, Sproule BJ, Chapman CB. The physiological meaning of the maximal oxygen intake test. J Clin Invest. 1958;37:538–547. - PMC - PubMed
    1. Levine BD, Buckey JC, Fritsch JM, Yancy CW, Jr, Watenpaugh DE, Snell PG, Lane LD, Eckberg DL, Blomqvist CG. Physical fitness and cardiovascular regulation: mechanisms of orthostatic intolerance. J Appl Physiol (1985) 1991;70:112–122. - PubMed
    1. Di Bello V, Santoro G, Talarico L, Di Muro C, Caputo MT, Giorgi D, Bertini A, Bianchi M, Giusti C. Left ventricular function during exercise in athletes and in sedentary men. Med Sci Sports Exerc. 1996;28:190–196. - PubMed
    1. Stickland MK, Welsh RC, Petersen SR, Tyberg JV, Anderson WD, Jones RL, Taylor DA, Bouffard M, Haykowsky MJ. Does fitness level modulate the cardiovascular hemodynamic response to exercise? J Appl Physiol (1985) 2006;100:1895–1901. - PubMed

Publication types