. 2014 Oct;26(10):3911-21.
doi: 10.1105/tpc.114.129031. Epub 2014 Oct 3.

Differentially phased leaf growth and movements in Arabidopsis depend on coordinated circadian and light regulation

Affiliations

Differentially phased leaf growth and movements in Arabidopsis depend on coordinated circadian and light regulation

Tino Dornbusch et al. Plant Cell. 2014 Oct.

Abstract

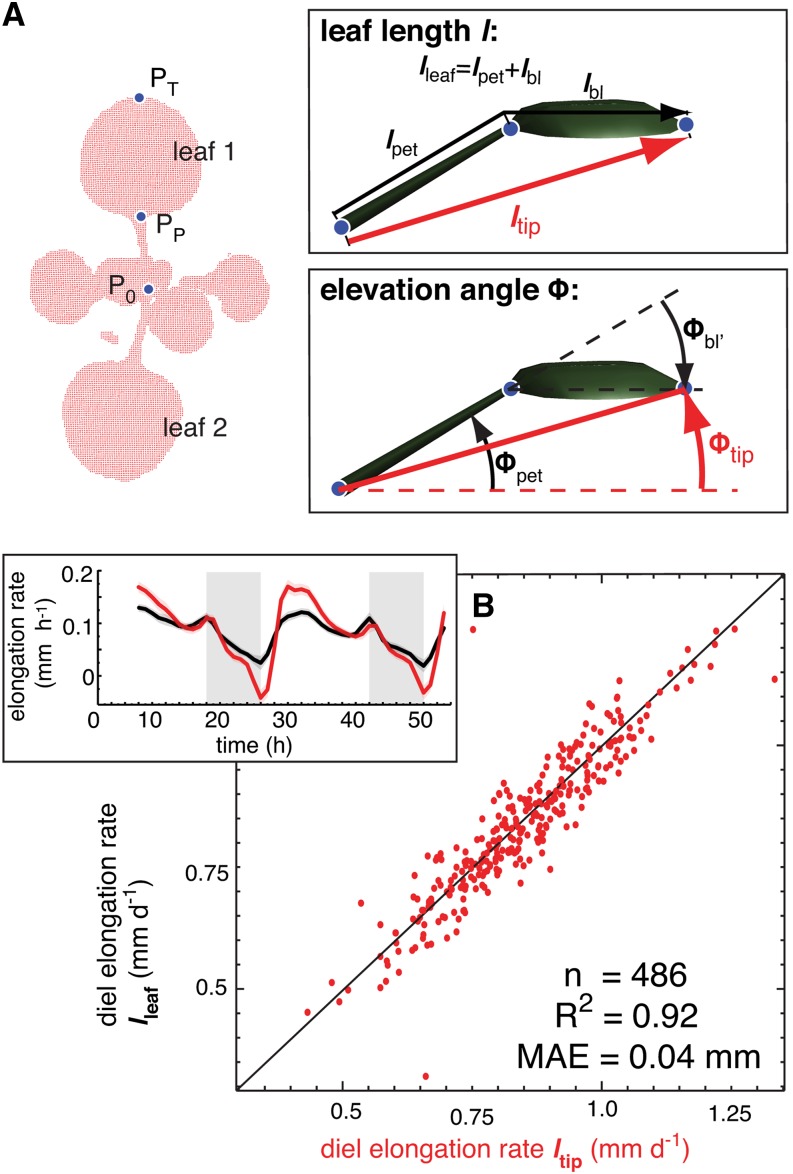
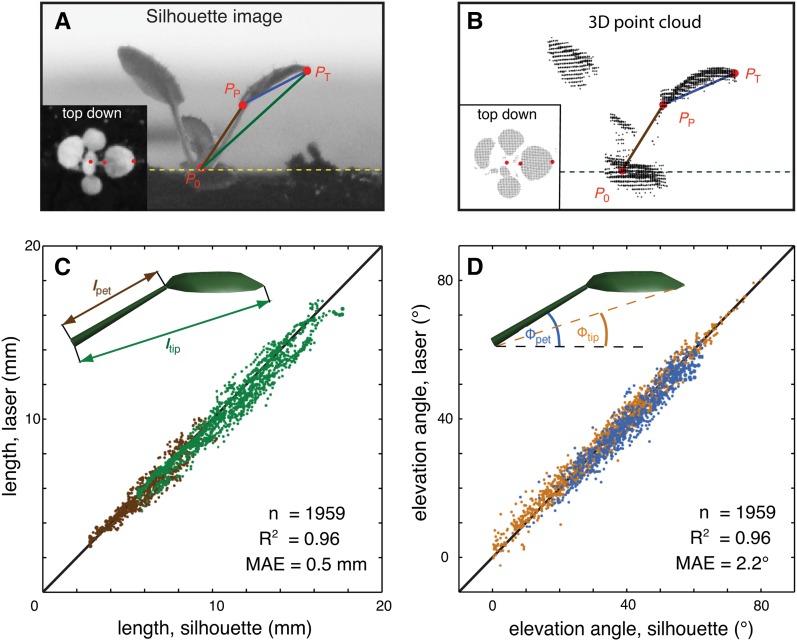
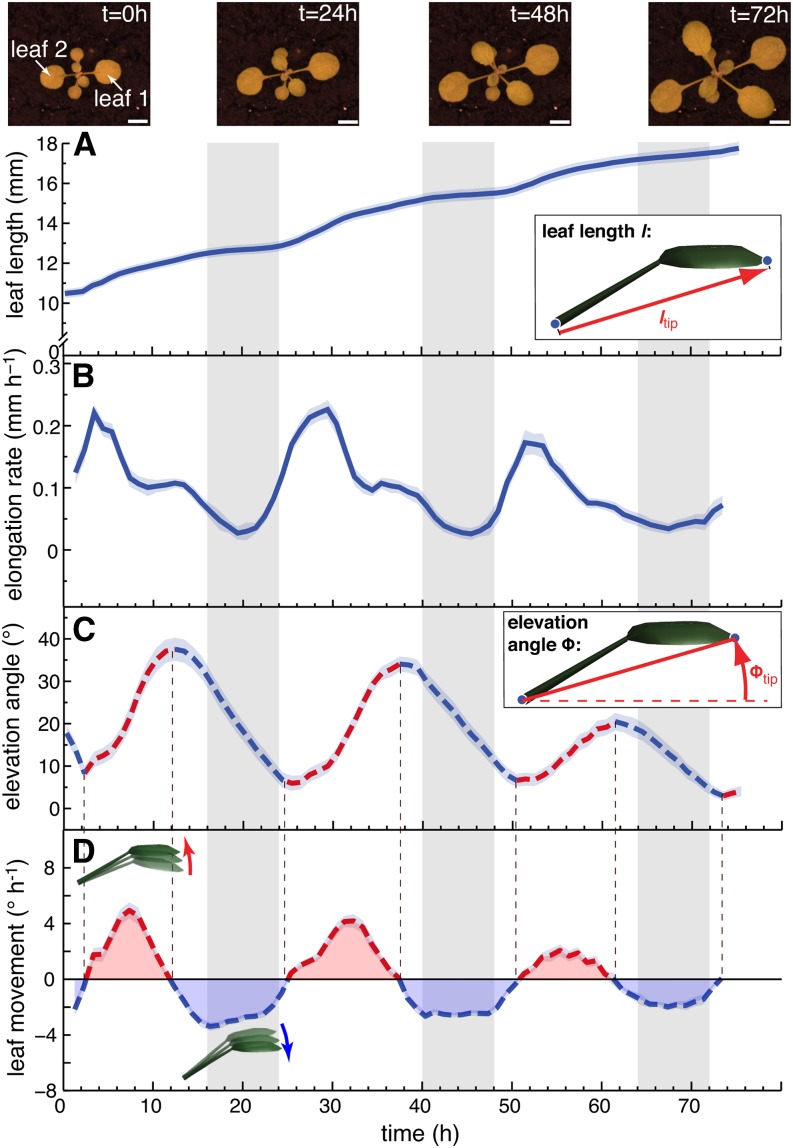
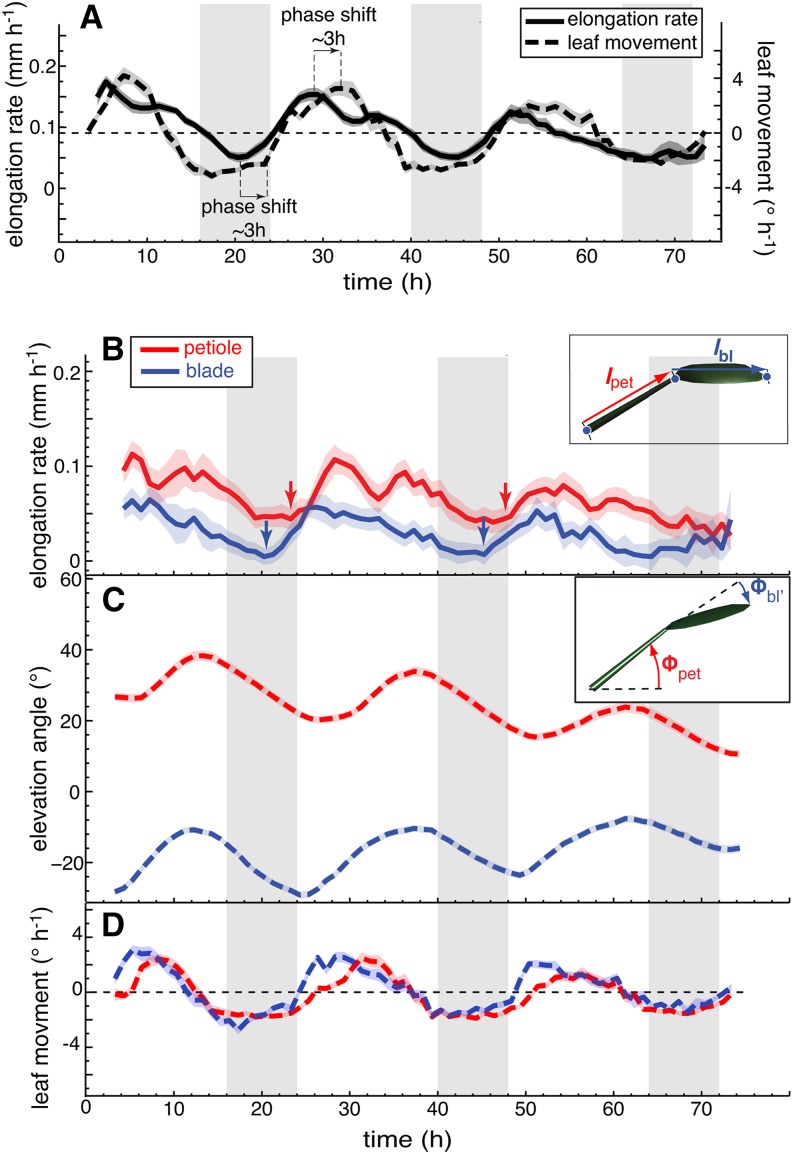
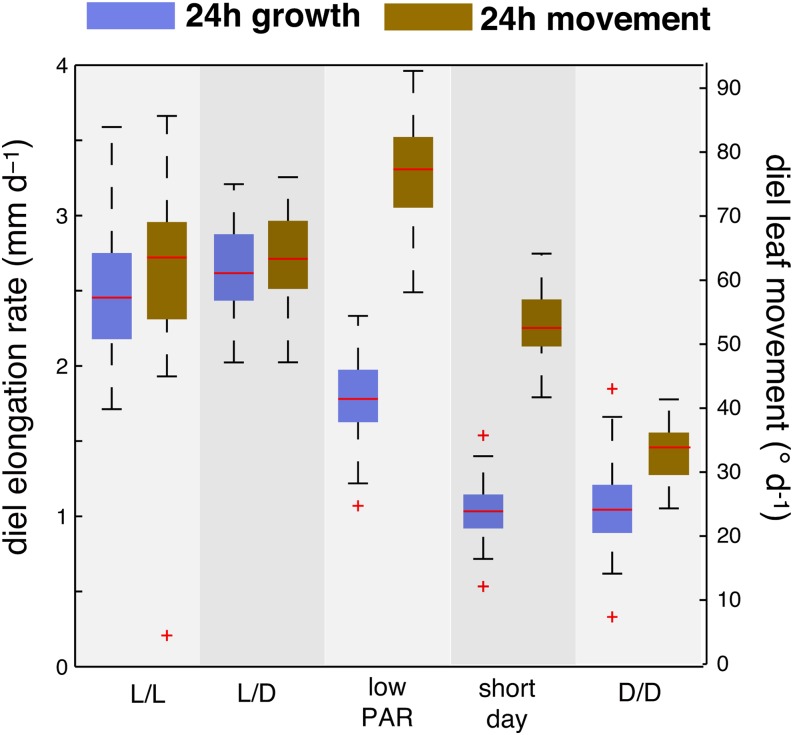
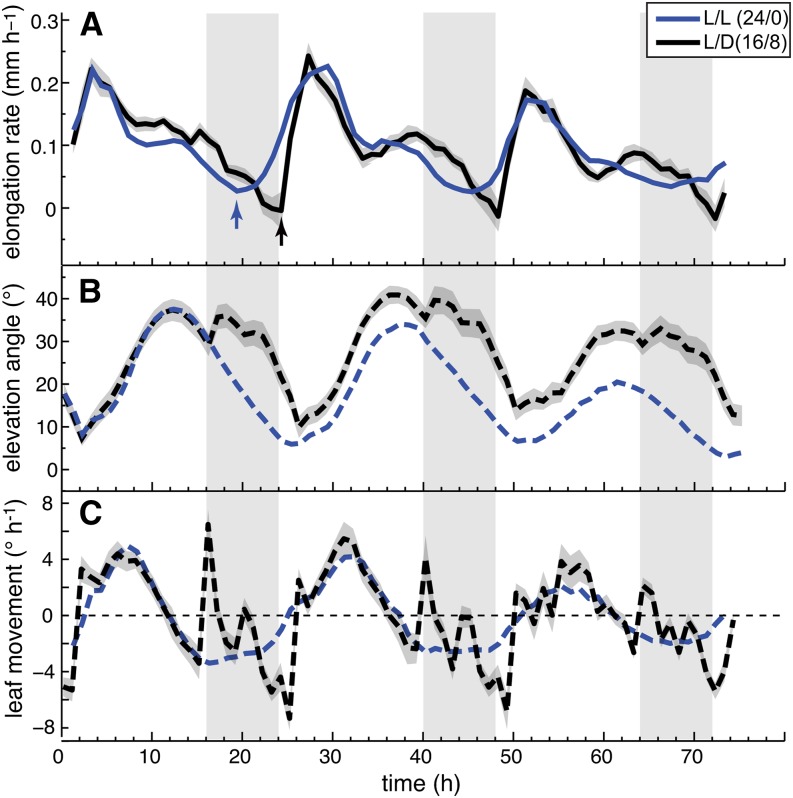
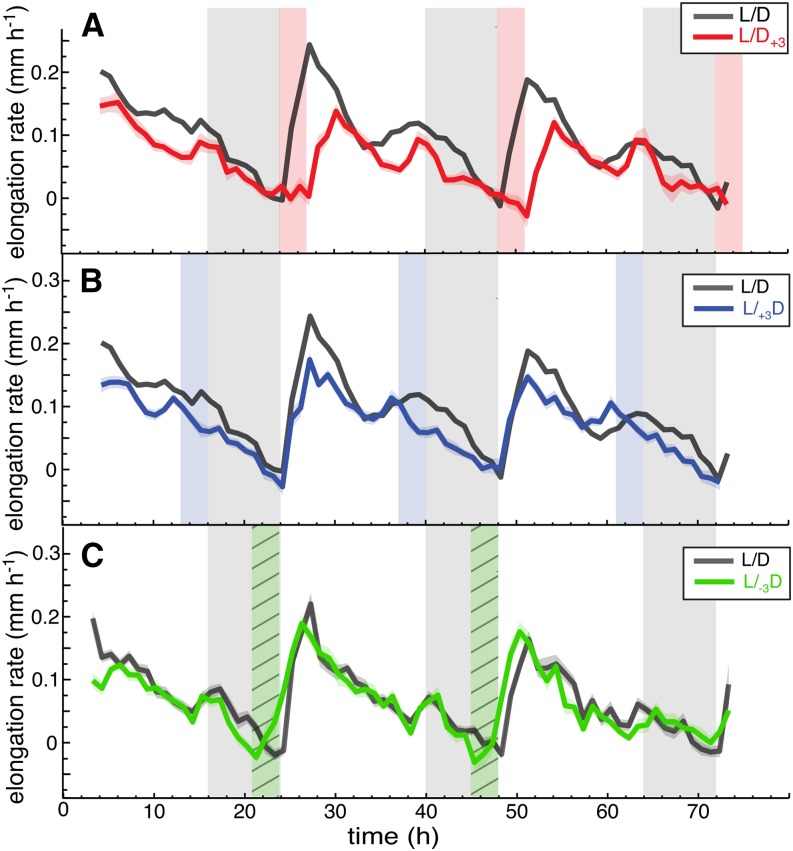
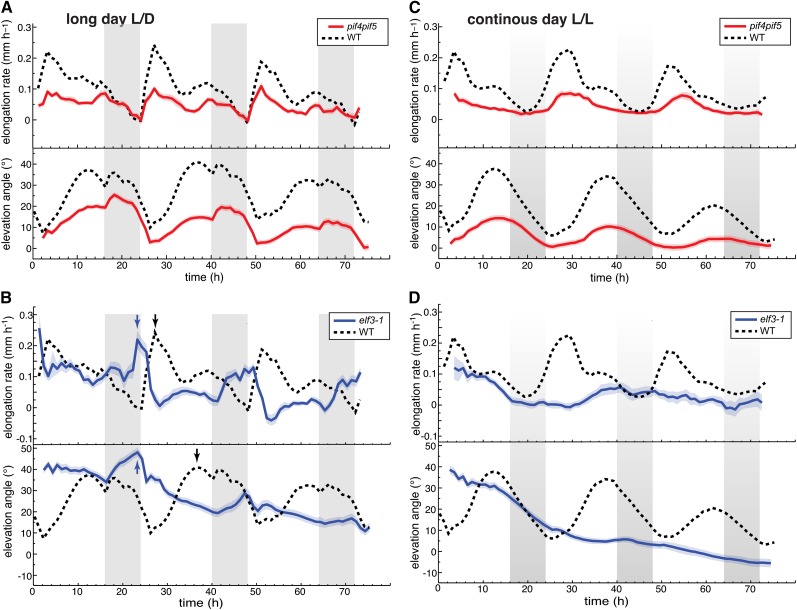
In contrast to vastly studied hypocotyl growth, little is known about diel regulation of leaf growth and its coordination with movements such as changes in leaf elevation angle (hyponasty). We developed a 3D live-leaf growth analysis system enabling simultaneous monitoring of growth and movements. Leaf growth is maximal several hours after dawn, requires light, and is regulated by daylength, suggesting coupling between growth and metabolism. We identify both blade and petiole positioning as important components of leaf movements in Arabidopsis thaliana and reveal a temporal delay between growth and movements. In hypocotyls, the combination of circadian expression of PHYTOCHROME INTERACTING FACTOR4 (PIF4) and PIF5 and their light-regulated protein stability drives rhythmic hypocotyl elongation with peak growth at dawn. We find that PIF4 and PIF5 are not essential to sustain rhythmic leaf growth but influence their amplitude. Furthermore, EARLY FLOWERING3, a member of the evening complex (EC), is required to maintain the correct phase between growth and movement. Our study shows that the mechanisms underlying rhythmic hypocotyl and leaf growth differ. Moreover, we reveal the temporal relationship between leaf elongation and movements and demonstrate the importance of the EC for the coordination of these phenotypic traits.


Figures

Figure 1.
Figure 1.
Definition of Measured Traits. (A) Geometric definition of leaf length and elevation angle. Arabidopsis plant as a measured 3D point cloud (red dots) viewed from top down. The points P0 (position of meristem), PP (position of petiole-blade junction), and PT (position of leaf tip) define length (l) and elevation angle (Φ) of the whole leaf (ltip, Φtip), of the petiole (lpet, Φpet), and of the blade (lbl, Φbl) as illustrated in the insets. (B) Comparison of diel (24 h) elongation rate using ltip and elongation rate using lleaf of leaf 1 and 2. One data point reflects one measurement per leaf per day. n = number of data points, R2 = coefficient of determination, MAE = mean absolute error. Col-0 plants were grown for 14 d in long-day conditions (L/D, 16/8) before measurement in L/D; the inset shows time courses of elongation rate as moving average over 3 h using lleaf (black line) or using ltip (red line); vertical gray bars represent true night periods. The colored opaque band (same color as mean line) is the 95% confidence interval of mean estimate (solid line).
Figure 2.
Figure 2.
Development and Validation of a Method for Live Measurements of Leaf Growth and Leaf Movements. (A) Silhouette image taken with an infrared-sensitive camera from the side and top-down (inset); three characteristic points define the dimension and orientation of each leaf and were manually selected: P0, shoot apical meristem; PP, blade-petiole junction; PT, leaf tip. (B) The laser scanner renders the plant surface as a 3D point cloud. The points P0, PP, and PT are computed for each leaf using a semiautomated image analysis algorithm. We simultaneously photographed and scanned 27 individual leaves over 48 h and compared values for P0, PP, and PT determined with each method. (C) Length of petiole (brown dots) and leaf (green dots) measured from silhouette images (x axis) plotted against corresponding values computed with our algorithm (y axis). (D) Petiole elevation angle (blue dots) and leaf elevation angle (orange dots) measured from silhouette images (x axis) plotted against corresponding values computed with our algorithm (y axis). One data point reflects one measurement per leaf per time step. Data of five different repeated control experiments were grouped together. Solid black line is the 1:1 line, n = number of data points, R2 = coefficient of determination, and MAE = mean absolute error.
Figure 3.
Figure 3.
The Pattern of Leaf Growth and Movements in Constant Light. Length (A), elongation rate (B), elevation angle (C), and movements (D) (angular rate of change) of leaves 1 and 2 in continuous day (L/L) measured on 43 leaves (30 plants). ltip ([A] and [B]) and Φtip ([C] and [D]) were used to compute the graphs. Images on top show a representative plant at times (t = 0, 24, 48, and 72 h) during the experiment (bar = 5 mm). Parts of the graph in (C) highlighted in red represent phases of upward and parts highlighted in blue phases of downward movement. Col-0 plants were grown for 14 d in standard L/D conditions. At time 0 h (ZT0), lights were switched on for imaging and kept on in L/L. Vertical gray bars represent subjective night periods. Leaf elongation rate was computed as mean moving average (3 h) of 43 individual curves. Leaf elevation angle and movement rates are mean values. The opaque band around the mean lines is the 95% confidence interval of mean estimate.
Figure 4.
Figure 4.
Blade and Petiole Movements Contribute to the Leaf Hyponastic Response. (A) Leaf elongation rate and leaf movements (angular rate of change) of leaves 1 and 2 in continuous day were replotted from Figures 3B and 3D for better direct comparison. (B) to (D) Leaf elongation rate (B), leaf elevation angle (C), and leaf movements (D) (angular rate of change) of petioles (in red) and blades (in blue) of leaves 1 and 2 in continuous day (L/L) measured on 32 leaves. Col-0 plants were grown for 14 d in standard L/D conditions. At time 0 h, lights were switched on for imaging and kept on in L/L. Vertical gray bars represent subjective night periods. Leaf elongation rate is computed as mean moving average (3 h) of 32 individual curves. Leaf elevation angle and movement rates are mean values. The opaque band around the mean lines is the 95% confidence interval of mean estimate. Arrows indicate acceleration of growth.
Figure 5.
Figure 5.
The Magnitude of Growth and Movements Is Differentially Affected by Decreasing Light Intensity and Daylength. Diel leaf elongation rate and leaf movement of leaves 1 and 2 (24 h period). Diel elongation rates and leaf movements (absolute changes in leaf elevation angle) were computed by summing hourly rates over a period of 24 h starting from ZT2.25. Col-0 plants were grown for 14 d in standard L/D conditions (16/8 h). At time 0 h, plants were imaged for 24 h in constant light (L/L; nleaf = 43), maintaining day-night cycles (L/D, nleaf = 27), reducing the light intensity (low PAR) but maintaining L/D (PAR=35 µmol m−2 s−1; nleaf = 57) and in continuous darkness (D/D; nleaf = 41). For the S/D experiment Col-0 was grown for 18 d in S/D (8/16 h) before imaging under the same conditions (nleaf = 47). nleaf = number of measured leaves.
Figure 6.
Figure 6.
Day-Night Transitions Alter Rhythmic Growth and Movements. Leaf elongation rate (A), leaf elevation angle (B), and leaf movements (C) (angular rate of change) of leaves 1 and 2 in continuous day (L/L; blue line; nleaf = 43) and long-day conditions (L/D; 16/8; black line, nleaf = 27). Col-0 plants were grown for 14 d in standard L/D conditions. Beginning from time 0 h, plants were imaged either in L/L or in L/D. Vertical gray bars represent subjective or true night periods. Leaf elongation rate was computed as mean moving average (3 h) of individual curves. Leaf elevation angle and movement rates are mean values. The opaque band around the mean lines is the 95% confidence interval of mean estimate. Arrows indicate acceleration of growth and nleaf = number of measured leaves. ltip and Φtip were used to compute the graphs.
Figure 7.
Figure 7.
Light Is Required at Dawn to Trigger Leaf Growth. (A) Leaf elongation rate of leaves 1 and 2 in long day (L/D, black line, nleaf = 27) and in +3 h prolonged night period after dawn (L/D+3; red line nleaf = 27). (B) Leaf elongation rate in L/D (black line) and in +3 h prolonged night period before dusk (L/+3D; blue line, nleaf = 54). (C) Leaf elongation rate and leaf elevation angle of leaves 1 and 2 where night was shortened before dawn by −3 h (L/-3D; green line, nleaf = 35; L/D control; black line, nleaf = 42). Col-0 plants were grown for 14 d in standard L/D (16/8) conditions before measurement; vertical gray bars represent true night periods; vertical red/blue bars indicate prolonged night periods ([A] and [B]) and vertical hatched green bar shortened night period (C). Leaf elongation rate was computed as mean moving average (3 h) of individual curves. The opaque band around the mean lines is the 95% confidence interval of mean estimate, and nleaf = number of leaves. Day 1 of the experiment represents the first day when the plants were subjected to an abrupt change in night length. ltip was used to compute the graphs.
Figure 8.
Figure 8.
The Role of PIF4, PIF5, and ELF3 in Establishing Rhythmic Leaf Growth and Movement. Leaf elongation rate and leaf elevation angle of leaves 1 and 2. Col-0, elf3-1, and pif4 pif5 plants were grown for 14 d in standard L/D conditions. Beginning from time 0 h, plants were imaged either in L/D ([A] and [B]) or in L/L ([C] and [D]). Leaf elongation rate was computed as mean moving average (3 h) of individual curves. Leaf elevation angle are mean values. Vertical gray bars represent subjective or true night periods. The opaque band around the mean lines is the 95% confidence interval of mean estimate. nleaf = number of measured leaves. ltip and Φtip were used to compute the graphs. (A) pif4 pif5 double mutant grown and imaged in long-day conditions nleaf = 48. (B) Clock mutant elf3-1 grown and imaged in long-day conditions nleaf = 45. Note that in elf3-1 the peaks of elevation angle and maximal growth coincide (blue arrows), while in the wild type there is a large phase shift between the two peaks (black arrows). (C) pif4 pif5 double mutant entrained in L/D and imaged in continuous light nleaf = 46. (D) elf3-1 entrained in L/D and grown in continuous light nleaf = 23.

Comment in

References

    1. Andriankaja M., Dhondt S., De Bodt S., Vanhaeren H., Coppens F., De Milde L., Mühlenbock P., Skirycz A., Gonzalez N., Beemster G.T., Inzé D. (2012). Exit from proliferation during leaf development in Arabidopsis thaliana: a not-so-gradual process. Dev. Cell 22: 64–78. - PubMed
    1. Barillot R., Frak E., Combes D., Durand J.L., Escobar-Gutiérrez A.J. (2010). What determines the complex kinetics of stomatal conductance under blueless PAR in Festuca arundinacea? Subsequent effects on leaf transpiration. J. Exp. Bot. 61: 2795–2806. - PMC - PubMed
    1. Bours R., Muthuraman M., Bouwmeester H., van der Krol A. (2012). OSCILLATOR: A system for analysis of diurnal leaf growth using infrared photography combined with wavelet transformation. Plant Methods 8: 29. - PMC - PubMed
    1. Bours R., van Zanten M., Pierik R., Bouwmeester H., van der Krol A. (2013). Antiphase light and temperature cycles affect PHYTOCHROME B-controlled ethylene sensitivity and biosynthesis, limiting leaf movement and growth of Arabidopsis. Plant Physiol. 163: 882–895. - PMC - PubMed
    1. Bridge L.J., Franklin K.A., Homer M.E. (2013). Impact of plant shoot architecture on leaf cooling: a coupled heat and mass transfer model. J. R. Soc. Interface 10: 20130326. - PMC - PubMed

Publication types

MeSH terms