

The mitochondrial genomes of the glaucophytes Gloeochaete wittrockiana and Cyanoptyche gloeocystis: multilocus phylogenetics suggests a monophyletic archaeplastida
- PMID: 25281844
- PMCID: PMC4224345
- DOI: 10.1093/gbe/evu218
The mitochondrial genomes of the glaucophytes Gloeochaete wittrockiana and Cyanoptyche gloeocystis: multilocus phylogenetics suggests a monophyletic archaeplastida
Abstract
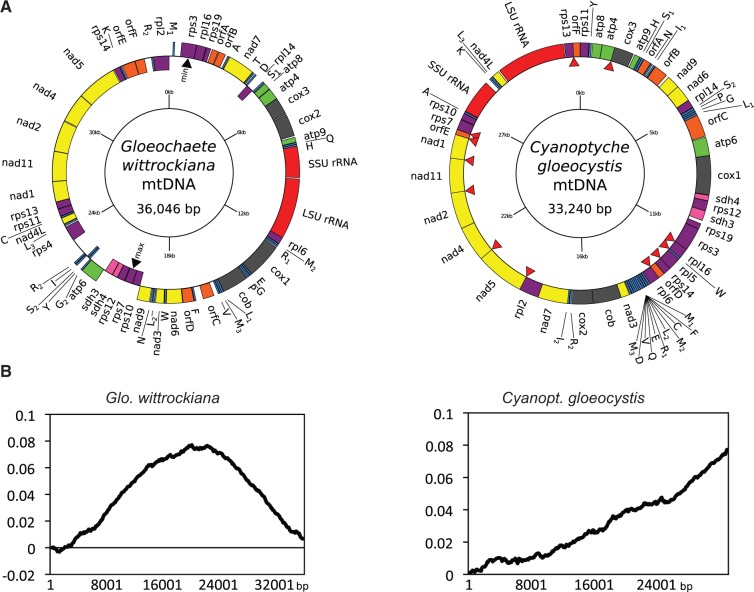
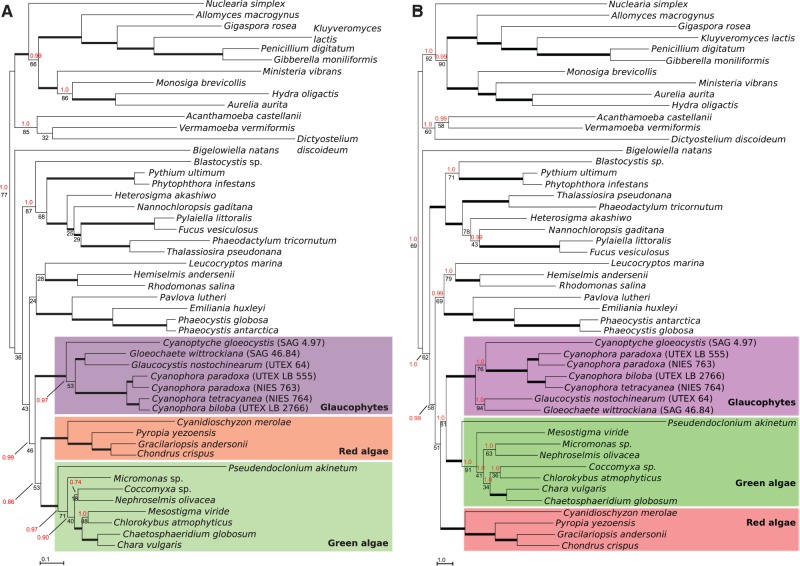
A significant limitation when testing the putative single origin of primary plastids and the monophyly of the Archaeplastida supergroup, comprised of the red algae, viridiplants, and glaucophytes, is the scarce nuclear and organellar genome data available from the latter lineage. The Glaucophyta are a key algal group when investigating the origin and early diversification of photosynthetic eukaryotes. However, so far only the plastid and mitochondrial genomes of the glaucophytes Cyanophora paradoxa (strain CCMP 329) and Glaucocystis nostochinearum (strain UTEX 64) have been completely sequenced. Here, we present the complete mitochondrial genomes of Gloeochaete wittrockiana SAG 46.84 (36.05 kb; 33 protein-coding genes, 6 unidentified open reading frames [ORFs], and 28 transfer RNAs [tRNAs]) and Cyanoptyche gloeocystis SAG 4.97 (33.24 kb; 33 protein-coding genes, 6 unidentified ORFs, and 26 tRNAs), which represent two genera distantly related to the "well-known" Cyanophora and Glaucocystis. The mitochondrial gene repertoire of the four glaucophyte species is highly conserved, whereas the gene order shows considerable variation. Phylogenetic analyses of 14 mitochondrial genes from representative taxa from the major eukaryotic supergroups, here including novel sequences from the glaucophytes Cyanophora tetracyanea (strain NIES-764) and Cyanophora biloba (strain UTEX LB 2766), recover a clade uniting the three Archaeplastida lineages; this recovery is dependent on our novel glaucophyte data, demonstrating the importance of greater taxon sampling within the glaucophytes.
Keywords: Cyanophora; Plantae; glaucophyta; phylogenetics.
© The Author(s) 2014. Published by Oxford University Press on behalf of the Society for Molecular Biology and Evolution.
Figures
Similar articles
-
Plastid Genomes from Diverse Glaucophyte Genera Reveal a Largely Conserved Gene Content and Limited Architectural Diversity.Genome Biol Evol. 2019 Jan 1;11(1):174-188. doi: 10.1093/gbe/evy268. Genome Biol Evol. 2019. PMID: 30534986 Free PMC article.
-
Molecular markers from different genomic compartments reveal cryptic diversity within glaucophyte species.Mol Phylogenet Evol. 2014 Jul;76:181-8. doi: 10.1016/j.ympev.2014.03.019. Epub 2014 Mar 28. Mol Phylogenet Evol. 2014. PMID: 24680917
-
High Sequence Divergence but Limited Architectural Rearrangements in Organelle Genomes of Cyanophora (Glaucophyta) Species.J Eukaryot Microbiol. 2021 Jan;68(1):e12831. doi: 10.1111/jeu.12831. Epub 2020 Dec 15. J Eukaryot Microbiol. 2021. PMID: 33142007
-
A new scenario of plastid evolution: plastid primary endosymbiosis before the divergence of the "Plantae," emended.J Plant Res. 2005 Aug;118(4):247-55. doi: 10.1007/s10265-005-0219-1. Epub 2005 Jul 20. J Plant Res. 2005. PMID: 16032387 Review.
-
Algal endosymbionts as vectors of horizontal gene transfer in photosynthetic eukaryotes.Front Plant Sci. 2013 Sep 19;4:366. doi: 10.3389/fpls.2013.00366. Front Plant Sci. 2013. PMID: 24065973 Free PMC article. Review.
Cited by
-
Major Changes in Plastid Protein Import and the Origin of the Chloroplastida.iScience. 2020 Mar 27;23(3):100896. doi: 10.1016/j.isci.2020.100896. Epub 2020 Feb 8. iScience. 2020. PMID: 32088393 Free PMC article.
-
The Origin and Evolution of the Plant Cell Surface: Algal Integrin-Associated Proteins and a New Family of Integrin-Like Cytoskeleton-ECM Linker Proteins.Genome Biol Evol. 2015 May 14;7(6):1580-9. doi: 10.1093/gbe/evv089. Genome Biol Evol. 2015. PMID: 25977459 Free PMC article.
-
Plastid Genomes from Diverse Glaucophyte Genera Reveal a Largely Conserved Gene Content and Limited Architectural Diversity.Genome Biol Evol. 2019 Jan 1;11(1):174-188. doi: 10.1093/gbe/evy268. Genome Biol Evol. 2019. PMID: 30534986 Free PMC article.
-
Analysis of an improved Cyanophora paradoxa genome assembly.DNA Res. 2019 Aug 1;26(4):287-299. doi: 10.1093/dnares/dsz009. DNA Res. 2019. PMID: 31098614 Free PMC article.
-
Recent advances in understanding mitochondrial genome diversity.F1000Res. 2020 Apr 17;9:F1000 Faculty Rev-270. doi: 10.12688/f1000research.21490.1. eCollection 2020. F1000Res. 2020. PMID: 32399193 Free PMC article. Review.
References
Publication types
MeSH terms
Substances
LinkOut - more resources
Full Text Sources
Other Literature Sources
Molecular Biology Databases
