

Vaporization dynamics of volatile perfluorocarbon droplets: a theoretical model and in vitro validation
- PMID: 25281982
- PMCID: PMC4290562
- DOI: 10.1118/1.4894804
Vaporization dynamics of volatile perfluorocarbon droplets: a theoretical model and in vitro validation
Abstract
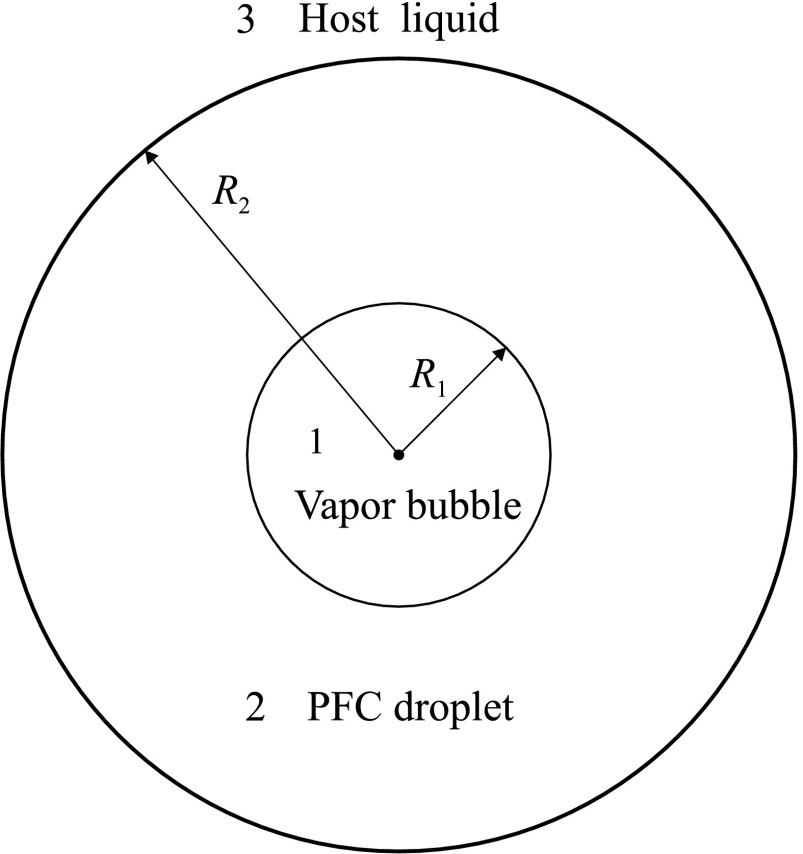
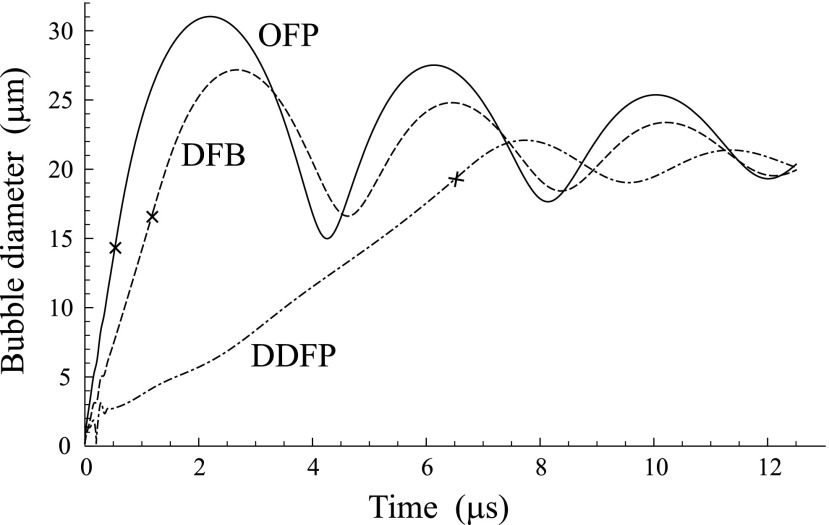
Purpose: Perfluorocarbon (PFC) microdroplets, called phase-change contrast agents (PCCAs), are a promising tool in ultrasound imaging and therapy. Interest in PCCAs is motivated by the fact that they can be triggered to transition from the liquid state to the gas state by an externally applied acoustic pulse. This property opens up new approaches to applications in ultrasound medicine. Insight into the physics of vaporization of PFC droplets is vital for effective use of PCCAs and for anticipating bioeffects. PCCAs composed of volatile PFCs (with low boiling point) exhibit complex dynamic behavior: after vaporization by a short acoustic pulse, a PFC droplet turns into a vapor bubble which undergoes overexpansion and damped radial oscillation until settling to a final diameter. This behavior has not been well described theoretically so far. The purpose of our study is to develop an improved theoretical model that describes the vaporization dynamics of volatile PFC droplets and to validate this model by comparison with in vitro experimental data.
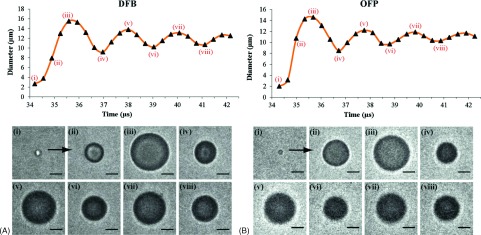
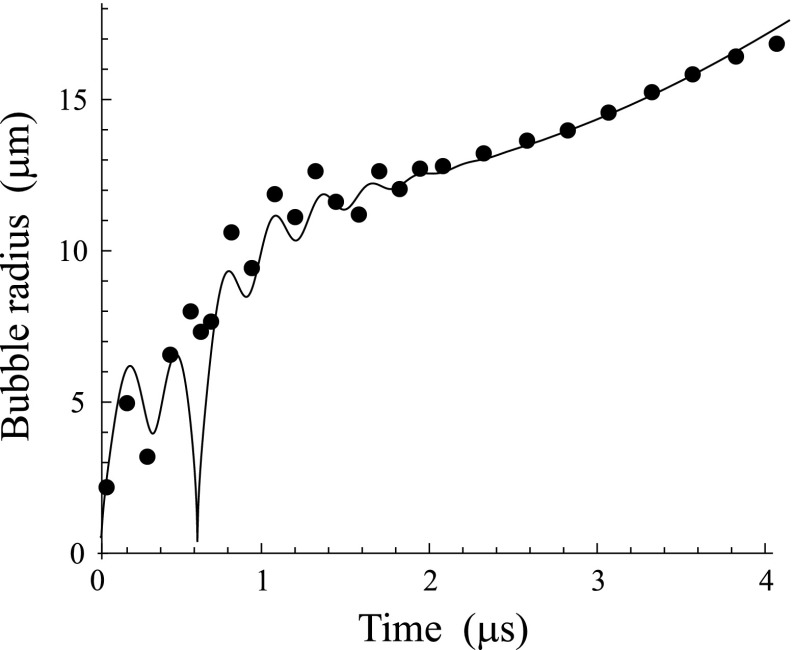
Methods: The derivation of the model is based on applying the mathematical methods of fluid dynamics and thermodynamics to the process of the acoustic vaporization of PFC droplets. The used approach corrects shortcomings of the existing models. The validation of the model is carried out by comparing simulated results with in vitro experimental data acquired by ultrahigh speed video microscopy for octafluoropropane (OFP) and decafluorobutane (DFB) microdroplets of different sizes.
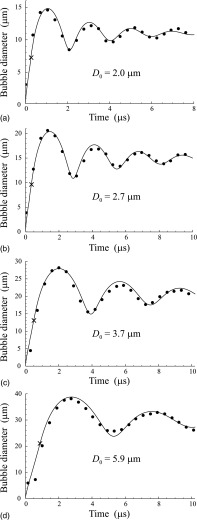
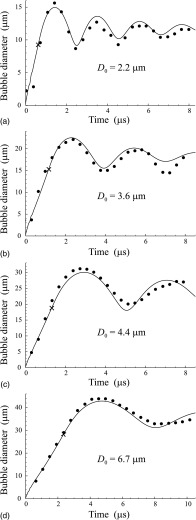
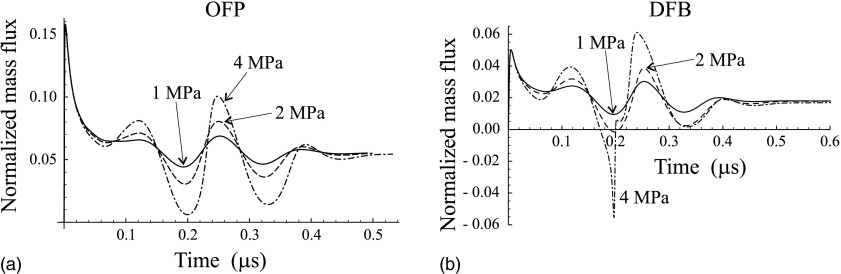
Results: The developed theory allows one to simulate the growth of a vapor bubble inside a PFC droplet until the liquid PFC is completely converted into vapor, and the subsequent overexpansion and damped oscillations of the vapor bubble, including the influence of an externally applied acoustic pulse. To evaluate quantitatively the difference between simulated and experimental results, the L2-norm errors were calculated for all cases where the simulated and experimental results are compared. These errors were found to be in the ranges of 0.043-0.067 and 0.037-0.088 for OFP and DFB droplets, respectively. These values allow one to consider agreement between the simulated and experimental results as good. This agreement is attained by varying only 2 of 16 model parameters which describe the material properties of gaseous and liquid PFCs and the liquid surrounding the PFC droplet. The fitting parameters are the viscosity and the surface tension of the surrounding liquid. All other model parameters are kept invariable.
Conclusions: The good agreement between the theoretical and experimental results suggests that the developed model is able to correctly describe the key physical processes underlying the vaporization dynamics of volatile PFC droplets. The necessity of varying the parameters of the surrounding liquid for fitting the experimental curves can be explained by the fact that the parts of the initial phospholipid shell of PFC droplets remain on the surface of vapor bubbles at the oscillatory stage and their presence affects the bubble dynamics.
Figures
Similar articles
-
Phase change events of volatile liquid perfluorocarbon contrast agents produce unique acoustic signatures.Phys Med Biol. 2014 Jan 20;59(2):379-401. doi: 10.1088/0031-9155/59/2/379. Epub 2013 Dec 19. Phys Med Biol. 2014. PMID: 24351961 Free PMC article.
-
The efficiency and stability of bubble formation by acoustic vaporization of submicron perfluorocarbon droplets.Ultrasonics. 2013 Sep;53(7):1368-76. doi: 10.1016/j.ultras.2013.04.005. Epub 2013 Apr 16. Ultrasonics. 2013. PMID: 23652262
-
Pulse sequences for uniform perfluorocarbon droplet vaporization and ultrasound imaging.Ultrasonics. 2014 Sep;54(7):2024-33. doi: 10.1016/j.ultras.2014.05.013. Epub 2014 Jun 6. Ultrasonics. 2014. PMID: 24965563
-
Bubble nucleation and dynamics in acoustic droplet vaporization: a review of concepts, applications, and new directions.Z Med Phys. 2023 Aug;33(3):387-406. doi: 10.1016/j.zemedi.2023.01.004. Epub 2023 Feb 10. Z Med Phys. 2023. PMID: 36775778 Free PMC article. Review.
-
Phase-change nanoparticles using highly volatile perfluorocarbons: toward a platform for extravascular ultrasound imaging.Theranostics. 2012;2(12):1185-98. doi: 10.7150/thno.4846. Epub 2012 Dec 23. Theranostics. 2012. PMID: 23382775 Free PMC article. Review.
Cited by
-
Investigation of the Post-Synthetic Confinement of Fluorous Liquids Inside Mesoporous Silica Nanoparticles.Langmuir. 2021 May 4;37(17):5222-5231. doi: 10.1021/acs.langmuir.1c00167. Epub 2021 Apr 22. Langmuir. 2021. PMID: 33886317 Free PMC article.
-
Initial nucleation of nanodroplets in viscoelastic tissue driven by ultrasound: A theoretical simulation.Ultrason Sonochem. 2025 Apr;115:107285. doi: 10.1016/j.ultsonch.2025.107285. Epub 2025 Feb 24. Ultrason Sonochem. 2025. PMID: 40037141 Free PMC article.
-
Review on Acoustic Droplet Vaporization in Ultrasound Diagnostics and Therapeutics.Biomed Res Int. 2019 Jul 14;2019:9480193. doi: 10.1155/2019/9480193. eCollection 2019. Biomed Res Int. 2019. PMID: 31392217 Free PMC article. Review.
-
Process, dynamics and bioeffects of acoustic droplet vaporization induced by dual-frequency focused ultrasound.Ultrason Sonochem. 2025 Feb;113:107234. doi: 10.1016/j.ultsonch.2025.107234. Epub 2025 Jan 20. Ultrason Sonochem. 2025. PMID: 39854984 Free PMC article.
-
Spatial-Temporal Cellular Bioeffects from Acoustic Droplet Vaporization.Theranostics. 2018 Nov 10;8(20):5731-5743. doi: 10.7150/thno.28782. eCollection 2018. Theranostics. 2018. PMID: 30555577 Free PMC article.
References
-
- Whittingham T. A., “Contrast-specific imaging techniques: Technical perspective,” in Contrast Media in Ultrasonography. Basic Principles and Clinical Applications, edited by Bart A. L. and Sartor K. (Springer, Berlin, 2005), pp. 43–76.
Publication types
MeSH terms
Substances
Grants and funding
LinkOut - more resources
Full Text Sources
Other Literature Sources
Miscellaneous
