. 2014 Nov;9(11):907-912.
doi: 10.1038/nnano.2014.208. Epub 2014 Oct 5.

Self-assembled micellar nanocomplexes comprising green tea catechin derivatives and protein drugs for cancer therapy

Affiliations

Self-assembled micellar nanocomplexes comprising green tea catechin derivatives and protein drugs for cancer therapy

Joo Eun Chung et al. Nat Nanotechnol. 2014 Nov.

Abstract

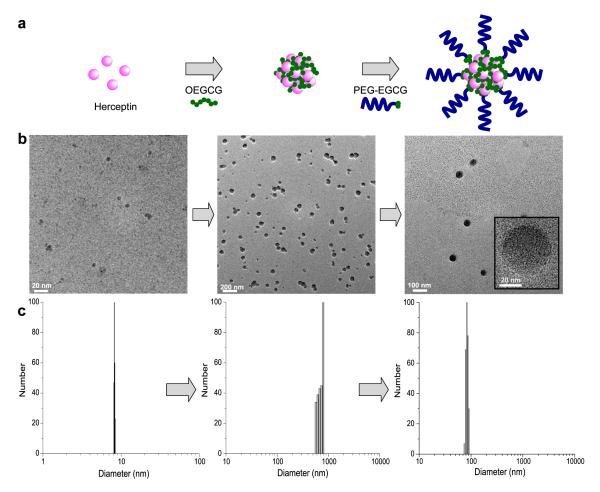
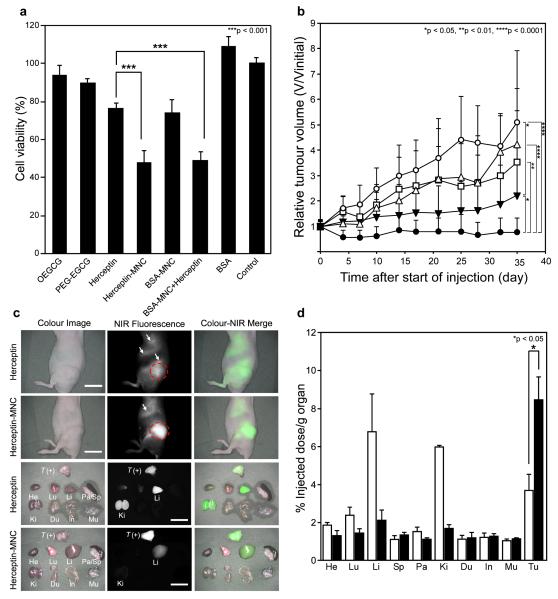
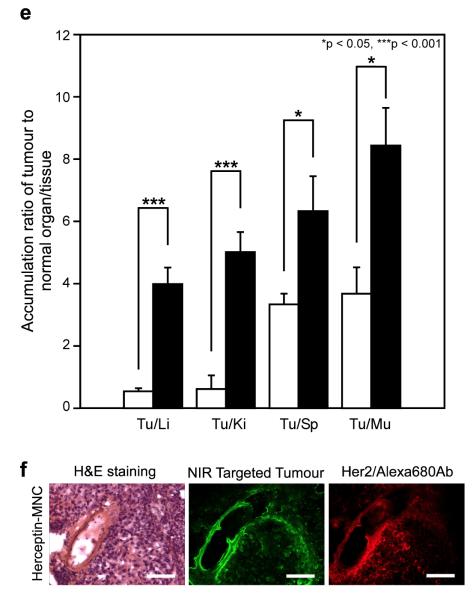
When designing drug carriers, the drug-to-carrier ratio is an important consideration, because the use of high quantities of carriers can result in toxicity as a consequence of poor metabolism and elimination of the carriers. However, these issues would be of less concern if both the drug and carrier had therapeutic effects. (-)-Epigallocatechin-3-O-gallate (EGCG), a major ingredient of green tea, has been shown, for example, to possess anticancer effects, anti-HIV effects, neuroprotective effects and DNA-protective effects. Here, we show that sequential self-assembly of the EGCG derivative with anticancer proteins leads to the formation of stable micellar nanocomplexes, which have greater anticancer effects in vitro and in vivo than the free protein. The micellar nanocomplex is obtained by complexation of oligomerized EGCG with the anticancer protein Herceptin to form the core, followed by complexation of poly(ethylene glycol)-EGCG to form the shell. When injected into mice, the Herceptin-loaded micellar nanocomplex demonstrates better tumour selectivity and growth reduction, as well as longer blood half-life, than free Herceptin.


Figures

Fig. 1
Fig. 1. Schematic diagram and morphology of self-assembled MNC loaded with proteins
a, Schematic diagram of the self-assembly process to form the MNC. The MNC was formed through two sequential self-assemblies in an aqueous solution: Complexation of OEGCG with proteins to form the core followed by complexation of PEG-EGCG surrounding the pre-formed core to form the shell. b, TEM images and c, hydrodynamic size distributions of complexes observed at each step of self-assembly.
Fig. 2
Fig. 2. Formation and dissociation of protein/OEGCG complexes
a, Size of Herceptin/OEGCG complexes formed at the given concentrations of OEGCG and Herceptin. The data indicated that OEGCG complexed with Herceptin via non-covalent bonds. The results are reported as mean values (n = 3). b, Complex dissociation by Tween 20 (white circles), Triton X-100 (white squares), SDS (white triangles), urea (black circles) and NaCl (black squares). Complexes were effectively dissociated by Tween 20, Triton X-100 and SDS due to hydrophobic competition, demonstrating the dominant mode of interaction between OEGCG and proteins was hydrophobic interaction. The data points represent mean values and the bars represent standard deviations (s.d.) (n = 3). c, Protein activities were restrained by complexation with OEGCG (white bars) and fully restored by dissociation (black bars) (protein/OEGCG w/w ratio = 1). Triton X-100 (0.1%) was used as a dissociator. The results are reported as mean values and the bars represent s.d. (n = 3).
Fig. 3
Fig. 3. The core-shell MNC formation
a, Complex size obtained when PEG-EGCG of various concentrations was added to the pre-formed Herceptin/OEGCG complexes (OEGCG = 0.09 μg ml−1 (white circles), 3 μg ml−1 (white squares), 6 μg ml−1 (white triangles) and 12 μg ml−1 (black circles)). PEG-EGCG assembled around the Herceptin/OEGCG complex of varied sizes, yielding uniformly sized complexes at the critical PEG-EGCG concentration required. The uniform size remained constant, despite further increase in the PEG-EGCG concentration. The data points represent mean values and the bars represent s.d. (n = 3). b, Complexes formed with various compositions and adding sequences. The sequential two-step self-assembly (the assembly of OEGCG with Herceptin followed by the PEG-EGCG assembly around the Herceptin/OEGCG complex) was necessary to construct the stable and spatially ordered MNC that showed no change in size by the post-addition of Herceptin. The results are reported as mean values and the bars represent s.d. (n = 3).
Fig. 4
Fig. 4. The anticancer effect and biodistribution of the MNC
a, BT-474 (human breast cancer cell) growth inhibitory effects by control (untreated), Herceptin (0.5 mg ml−1), Herceptin-MNC (Herceptin/OEGCG/PEG-EGCG = 0.5/0.024/0.26 mg ml−1), BSA-MNC (drug-free carrier, with the equivalents), a mixture of BSA-MNC and Herceptin (with the equivalents), BSA (with the equivalent), OEGCG and PEG-EGCG (carrier components, with the equivalents). Herceptin-MNC showed a higher cancer cell growth inhibitory effect than free Herceptin via synergism of the inhibitory effects of the carrier and Herceptin. n = 5 (mean ± s.d.), ***p < 0.001. b, Anticancer effect on BT-474-xenografted nude mouse model. PBS (vehicle control, white circles), BSA-MNC (white triangles), Herceptin (2.5 mg kg−1, white squares), sequential injection of BSA-MNC and Herceptin (black inverted triangles), and Herceptin-MNC (black circles) in the same formulations as those used in Fig. 4a. Herceptin-MNC showed a significantly higher anticancer effect than sequentially injected BSA-MNC and Herceptin, as well as free Herceptin. n = 12 (mean ± s.d.), *p < 0.05, **p < 0.01, ****p < 0.0001. c, Real-time intraoperative tumour detection and NIR fluorescence image-guided resection at 24 h post-injection. Arrows = nonspecific uptake (liver, kidneys, intestine); red dotted circle = ROI; T (+), positive tumour; He, heart; Lu, lung; Li, liver; Pa, pancreas; Sp, spleen; Ki, kidneys; Du, duodenum; In, intestine; Mu, muscle. Scale bars = 1 cm. d, Biodistribution of Herceptin (white bars) and Herceptin-MNC (black bars) in major organs measured at 24 h post-injection. Herceptin-MNC exhibited 2.3-fold higher accumulation in tumour and 0.3-, 0.3- and 0.6-fold lower accumulation in liver, kidney and lung, respectively, as compared to free Herceptin at 24 h post-injection. n = 5 (mean ± s.d.), *p < 0.05. e, Tumour-to-background (normal organ/tissue) ratio for Herceptin (white bars) and Herceptin-MNC (black bars) at 24 h post-injection. Herceptin-MNC showed the improved tumour selectivity to surrounding normal organs/tissues, as compared to free Herceptin. n = 5 (mean ± s.d.), *p < 0.05, ***p < 0.001, Tu, tumour; Li, liver; Ki, kidney; Sp, spleen; Mu, muscle. f, H&E staining (left), targeted NIR fluorescence (middle,pseudocoloured in lime green), and immunofluorescence staining (right, pseudocoloured in red) images of BT-474 xenograft tumour at 24 h post-injection. Herceptin-MNCs were observed throughout the extravascular space, which was consistent with the localization of overexpressed HER2/neu receptors on the tumour, suggesting extravasation and deep tumour penetration of Herceptin-MNC. Scale bars = 100 μm. All NIR fluorescence images have identical exposure times and normalization.

References

    1. Allen TM, Cullis PR. Drug delivery systems: entering the mainstream. Science. 2004;303:1818–1822. - PubMed
    1. Cao Y, Cao R. Angiogenesis inhibited by drinking tea. Nature. 1999;398:381. - PubMed
    1. Jankun J, Selman SH, Swiercz R, Skrzypczak-Jankun E. Why drinking green tea could prevent cancer. Nature. 1997;387:561. - PubMed
    1. Tachibana H, Koga K, Fujimura Y, Yamada K. A receptor for green tea polyphenol EGCG. Nat Struct Mol Biol. 2004;11:380–381. - PubMed
    1. Liang G, et al. Green tea catechins augment the antitumor activity of doxorubicin in an in vivo mouse model for chemoresistant liver cancer. Int J Oncol. 2010;37:111–123. - PubMed

Publication types

MeSH terms