. 2014 Nov;20(11):1270-8.
doi: 10.1038/nm.3668. Epub 2014 Oct 5.

PDGF-BB secreted by preosteoclasts induces angiogenesis during coupling with osteogenesis

Affiliations

PDGF-BB secreted by preosteoclasts induces angiogenesis during coupling with osteogenesis

Hui Xie et al. Nat Med. 2014 Nov.

Abstract

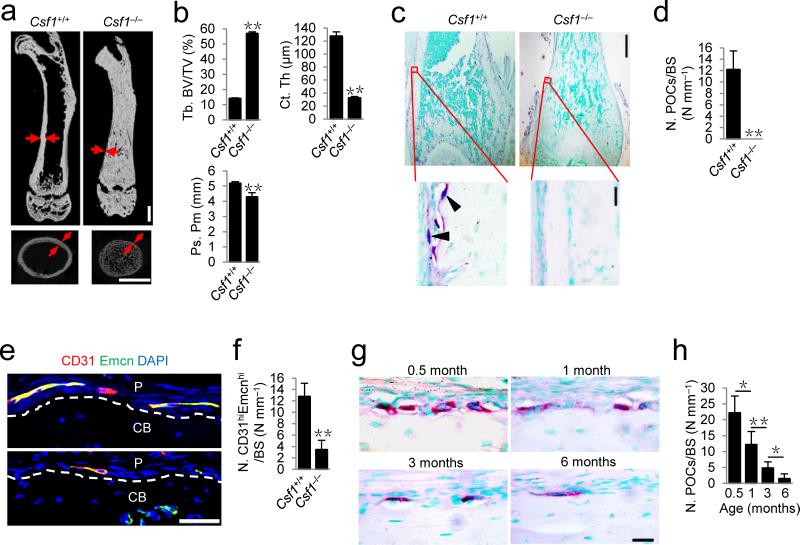
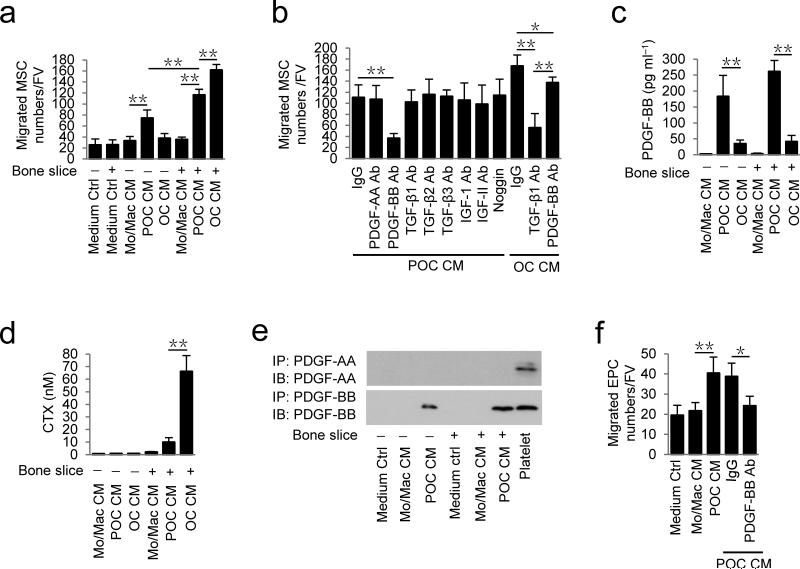
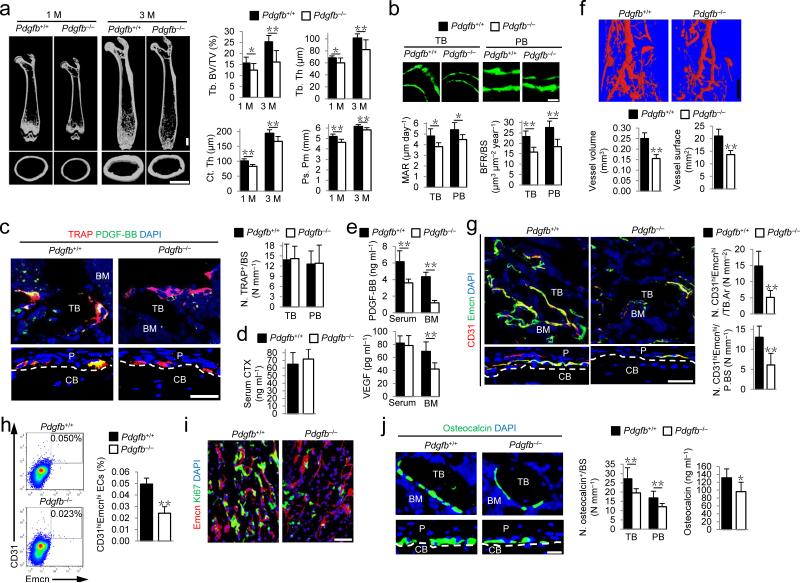
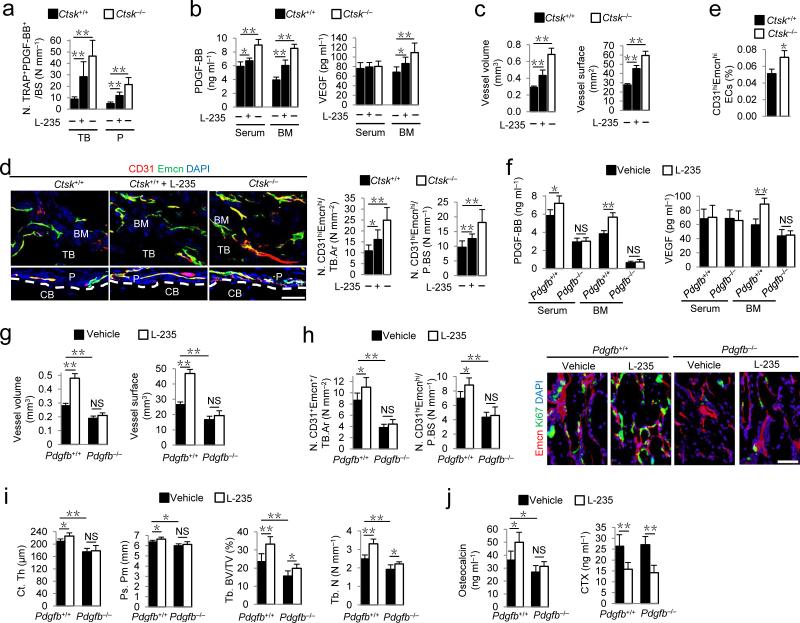
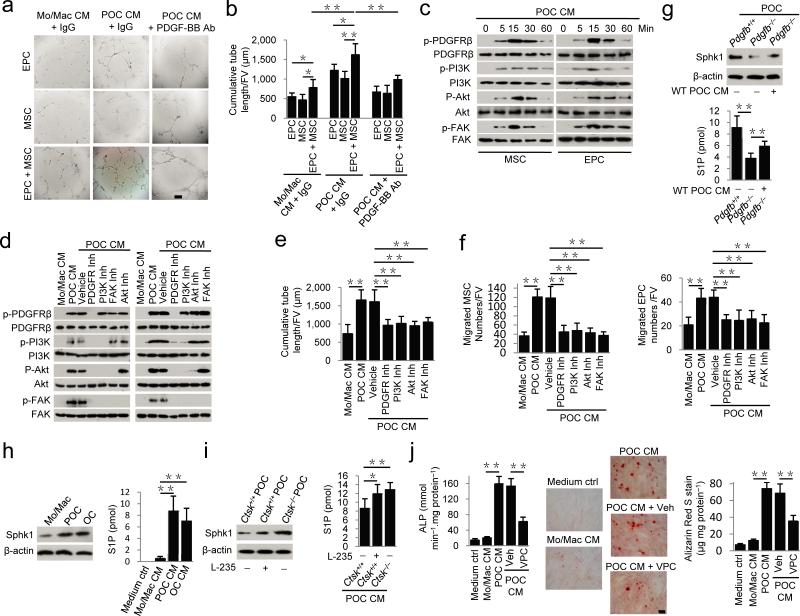
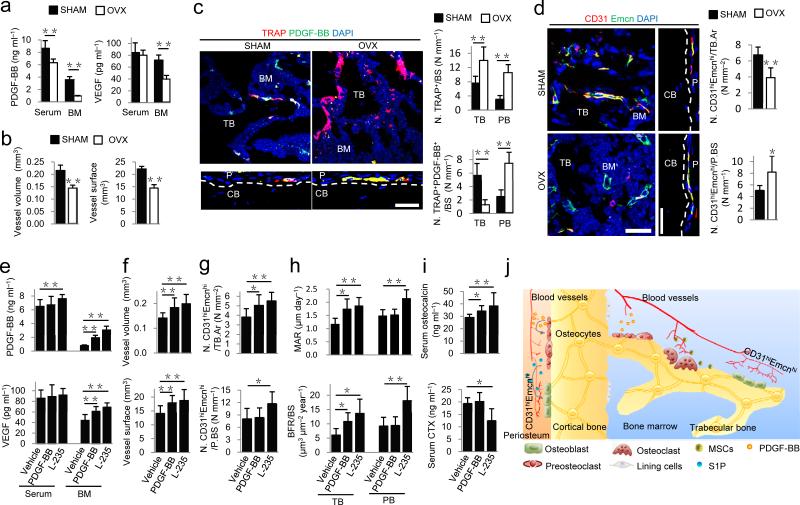
Osteogenesis during bone modeling and remodeling is coupled with angiogenesis. A recent study showed that a specific vessel subtype, strongly positive for CD31 and endomucin (CD31(hi)Emcn(hi)), couples angiogenesis and osteogenesis. Here, we found that platelet-derived growth factor-BB (PDGF-BB) secreted by preosteoclasts induces CD31(hi)Emcn(hi) vessel formation during bone modeling and remodeling. Mice with depletion of PDGF-BB in the tartrate-resistant acid phosphatase-positive cell lineage show significantly lower trabecular and cortical bone mass, serum and bone marrow PDGF-BB concentrations, and fewer CD31(hi)Emcn(hi) vessels compared to wild-type mice. In the ovariectomy (OVX)-induced osteoporotic mouse model, serum and bone marrow levels of PDGF-BB and numbers of CD31(hi)Emcn(hi) vessels are significantly lower compared to sham-operated controls. Treatment with exogenous PDGF-BB or inhibition of cathepsin K to increase the number of preosteoclasts, and thus the endogenous levels of PDGF-BB, increases CD31(hi)Emcn(hi) vessel number and stimulates bone formation in OVX mice. Thus, pharmacotherapies that increase PDGF-BB secretion from preosteoclasts offer a new therapeutic target for treating osteoporosis by promoting angiogenesis and thus bone formation.


Figures

Figure 1
Figure 1
TRAP+ cell deficient mice exhibit reduced cortical bone. (a) μCT images of femora. Red arrows indicate cortical bone. Scale bars, 1 mm. (b) Quantitative μCT analysis of the trabecular bone fraction (Tb. BV/TV), cortical thickness (Ct. Th) and periosteal perimeter (Ps. Pm) of femora. n = 3. (c,d) TRAP staining images (c) and quantitative analyses of the number of preosteoclasts (N. POCs) on periosteal bone surface (BS) (d) of femoral diaphysis. Black arrowheads indicate preosteocasts. Scale bars, 500 μm (top), 20 μm (bottom). n = 5. (e,f) Confocal images of immunostaining of CD31 (red), Endomucin (green), and DAPI (blue) staining of nuclei (e), and quantitative analysis (f) of the number of cells notably positive for both CD31 and Endomucin (CD31hiEmcnhi, yellow) in femoral diaphyseal periosteum. Dashed lines outline the bone surface. P, periosteum; CB, cortical bone. Scale bar, 50 μm. n = 5. (g,h) TRAP staining images (g) and quantitative analysis of the number of preosteoclasts (N. POCs) on periosteal bone surface (h) of femoral diaphysis of the wild-type male mice at different ages. Scale bar, 20 μm. n = 5. Data are shown as the mean ± s.d. *P < 0.05, **P < 0.01 (b,d,f, t test; h, ANOVA).
Figure 2
Figure 2
Preosteoclasts secrete PDGF-BB to induce migration of MSCs and EPCs. (a) Transwell assays for the migration of MSCs using conditioned medium (CM) collected from different cell cultures with (+) or without (−) bone slices. (b) Transwell assays for the migration of MSCs using conditioned medium of preosteoclasts + bone slices (POC CM) with addition of individual neutralizing antibody (Ab), IgG or Noggin, as indicated; or using conditioned medium of osteoclasts + bone slices (OC CM) with addition of individual neutralizing Ab or IgG. (c,d) ELISA analysis of concentrations of PDGF-BB (c) and CTX (d) in different conditioned media. (e) Immunoprecipitation and immunoblotting analysis of PDGF-BB levels in different conditioned media. Platelet: mouse platelet lysate (positive control). (f) Transwell assays for the migration of EPC using conditioned media from different cell cultures as indicated or conditioned medium of preosteoclasts + bone slices (POC CM) with addition of IgG or PDGF-BB neutralizing Ab. FV: field of view (×200 magnification). Medium Ctrl: serum free α-MEM. Mo/Mac: monocytes/macrophages; POC: preosteoclasts; OC: osteoclasts. n = 4. Data are shown as the mean ± s.d. *P < 0.05, **P < 0.01 (ANOVA).
Figure 3
Figure 3
Knockout of PDGF-BB in preosteoclasts reduces CD31hiEmcnhi vessels and bone formation. (a) μCT images and quantification of trabecular bone fraction (Tb. BV/TV), trabecular thickness (Tb. Th), cortical thickness (Ct. Th), and periosteal perimeter (Ps. Pm). Scale bars, 1 mm. (b) Calcein double labeling of trabecular (TB) and periosteal bone (PB) with quantification of mineral apposition rate (MAR) and bone formation rate (BFR). Scale bar, 20 μm. n = 5. (c) Immunostaining of TRAP (red) and PDGF-BB (green) with quantification of number of TRAP positive cells (N. TRAP+) per respective bone surface (BS). Scale bar, 50 μm. (d,e) ELISA for serum CTX (d), serum or bone marrow (BM) PDGF-BB and VEGF concentrations (e). (f) Microphil-perfused angiography with quantification of vessel volume and surface. Scale bar, 1 mm. n = 5. (g) Immunostaining of CD31 (red) and Endomucin (green) with quantification of CD31hiEmcnhi (yellow) cells in BM and periosteum (P) (bottom). Scale bar, 50 μm. (h) Flow cytometry plots (left) with percentage (right) of CD31hiEmcnhi cells in total bone marrow cells (BMCs). n = 4. (i) Immunostaining of Endomucin (red) and Ki67 (green). (j) Immunostaining of Osteocalcin (green) (left) with quantification of osteocalcin+ cell numbers (middle) on TB and PB surface. Serum osteocalcin concentrations by ELISA (right). Scale bar, 20 μm. Dashed lines outline bone surface. DAPI stains (blue) nuclei. CB, cortical bone; BM, bone marrow. Data are shown as the mean ± s.d. n = 7−8, unless otherwise noted. *P < 0.05, **P < 0.01 versus Pdgfb+/+ (t test).
Figure 4
Figure 4
CTSK inhibitor increases TRAP+ cell PDGF-BB secretion to couple CD31hiEmcnhi vessels with bone formation. (a) Quantification of cells positive immunostaining for TRAP and PDGF-BB (N. TRAP+PDGF-BB+) on trabecular (TB) and periosteal (P) bone in wild-type (Ctsk+/+) with or without cathepsin K inhibitor (L-235) or knockout (Ctsk–/–) mice. n = 8. (b) PDGF-BB and VEGF concentrations by ELISA in serum and bone marrow (BM). n = 8. (c) Quantification of vessel volume and surface. n = 6. (d) CD31 (red) and Endomucin (green) immunostaining with quantification of CD31hiEmcnhi (yellow) cells. Scale bar, 50 μm. n = 8. (e) Percentage of CD31hiEmcnhi cells in total BM cells (BMCs) by flow cytometry. n = 3. (f) PDGF-BB and VEGF concentrations by ELISA in serum and BM of Pdgfb–/–or Pdgfb+/+ littermates treated with vehicle or L-235. n = 5. (g) Quantification of vessel volume and surface. n = 5. (h) Quantification of CD31hiEmcnhi immunostaining in TB (left) and P (middle). n = 5. Endomucin (red) and Ki67 (green) immunostaining of proliferating endothelial cells (right). (i) μCT quantification of cortical thickness (Ct. Th), periosteal perimeter (Ps. Pm), trabecular bone fraction (Tb. BV/TV) and trabecular thickness (Tb. Th). n = 5. (j) Serum osteocalcin and CTX concentrations by ELISA. n = 5. Dashed lines outline bone surface. DAPI stains (blue) nuclei. CB: cortical bone. Data shown as mean ± s.d. *P < 0.05, **P < 0.01, NS, not significant (ANOVA).
Figure 5
Figure 5
Preosteoclast conditioned medium induces tube formation by MSCs and EPCs via Akt-dependent phosphorylation of FAK. (a,b) Matrigel tube formation assay images (a) and quantitative analysis of cumulative tube length (b) with MSC, EPC or both co-cultures using monocyte/macrophage (Mo/Mac) or preosteoclast (POC) conditioned medium (CM) with or without addition of neutralizing PDGF-BB antibody as indicated. Scale bar, 200 μm. (c,d) Western blot of the phosphorylation of PDGFRβ, PI3K, Akt and FAK in MSCs and EPCs treated with POC CM alone for 5−60 min (c), or plus respective inhibitors (d). (e) Quantitative analysis of POC CM-induced matrigel tube formation of MSC and EPC co-cultures pre-incubated with vehicle or respective inhibitors. (f) Transwell assays for POC CM-induced migration of MSCs (left) or EPCs (right) treated with vehicle or respective inhibitors. (g−i) Western blot of Sphk1 and β-actin (top) and mass spectrometry analysis of secreted S1P concentrations (bottom) in POC from Pdgfb+/+ or Pdgfb–/– mice with or without wild-type (WT) POC CM treatment (g), in different cells as indicated (h), or in POC from Pdgfb–/–or Pdgfb+/+ mice with or without cathepsin K inhibitor (L-235) treatment (i). (j) Alkaline phosphatase activity (left), Alizarin Red S (ARS) staining (middle), and ARS-based quantification of matrix mineralization (right) of MSCs were treated with CM as indicated in the presence or absence of an S1P receptor antagonist VPC23019 (VPC). Scale bar, 100 μm. OC: osteoclasts. n = 6. Data shown as mean ± s.d. *P < 0.05, **P < 0.01 (ANOVA).
Figure 6
Figure 6
Increasing PDGF-BB stimulates CD31hiEmcnhi vessels and bone formation in OVX osteoporotic mice. (a) PDGF-BB and VEGF concentrations by ELISA in serum and bone marrow (BM) in sham-operated (SHAM) or ovariectomized mice (OVX). (b) Quantification of vessel volume and surface. (c) TRAP (red) and PDGF-BB (green) immunostaining and quantification of TRAP+ and TRAP+PDGF-BB+ cells on trabecular (TB) and periosteal bone (PB) surfaces, respectively. (d) CD31 (red) and Endomucin (green) immunostaining and quantification of CD31hiEmcnhi (yellow) cells in BM and periosteum. Scale bar, 50 μm. (e) PDGF-BB and VEGF concentrations by ELISA in serum and bone marrow of OVX mice treated with vehicle, PDGF-BB, or cathepsin K inhibitor (L-235). (f,g) Quantification of vessel volume and surface (f) and immunostaining of CD31hiEmcnhi cells (g). (h) Quantificaion of mineral apposition rate (MAR) and bone formation rate (BFR) in TB and periosteal bone (PB). (i) Serum osteocalcin and CTX concentrations by ELISA. (j) Model of PDGF-BB secreted by preosteoclasts to couple angiogenesis and osteogenesis. In periosteal bone modeling, preosteoclast secretion of PDGF-BB induces formation of CD31hiEmcnhi vessels and stimulates secretion of S1P to promote osteoblast differentiation. In trabecular bone remodeling, CD31hiEmcnhi vessels induced by preosteoclast secretion of PDGF-BB improves transport of nutrients, oxygen, minerals and metabolic wastes during bone remodeling. Dashed lines outline bone surface. Scale bar, 50 μm. Data shown as mean ± s.d. For a−d and h n = 5; For eg and i n = 10. *P < 0.05, **P < 0.01 (t-test and ANOVA).

Comment in

References

    1. Seeman E. Bone modeling and remodeling. Crit Rev Eukaryot Gene Expr. 2009;19:219–233. - PubMed
    1. Teti A. Bone development: overview of bone cells and signaling. Current osteoporosis reports. 2011;9:264–273. - PubMed
    1. Eriksen EF. Cellular mechanisms of bone remodeling. Reviews in endocrine & metabolic disorders. 2010;11:219–227. - PMC - PubMed
    1. Zaidi M. Skeletal remodeling in health and disease. Nat Med. 2007;13:791–801. - PubMed
    1. Portal-Nunez S, Lozano D, Esbrit P. Role of angiogenesis on bone formation. Histol Histopathol. 2012;27:559–566. - PubMed

Publication types

MeSH terms