. 2014 Oct 4;15(1):338.
doi: 10.1186/1471-2105-15-338.

Systematic exploration of guide-tree topology effects for small protein alignments

Affiliations

Systematic exploration of guide-tree topology effects for small protein alignments

Fabian Sievers et al. BMC Bioinformatics. .

Abstract

Background: Guide-trees are used as part of an essential heuristic to enable the calculation of multiple sequence alignments. They have been the focus of much method development but there has been little effort at determining systematically, which guide-trees, if any, give the best alignments. Some guide-tree construction schemes are based on pair-wise distances amongst unaligned sequences. Others try to emulate an underlying evolutionary tree and involve various iteration methods.

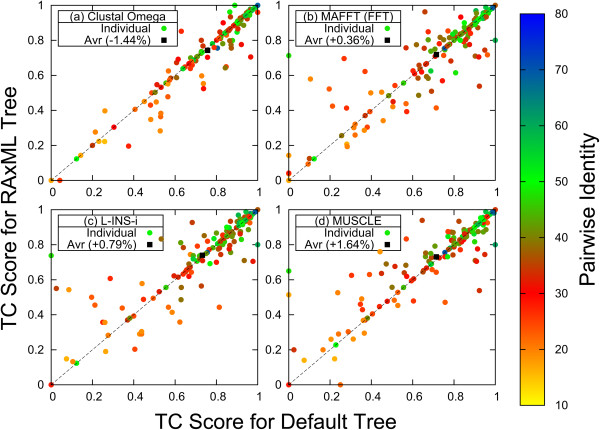
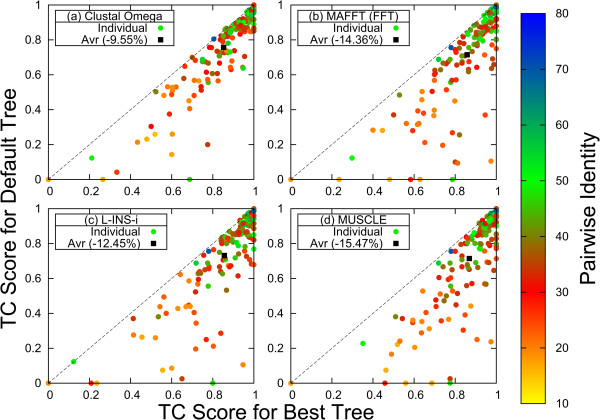
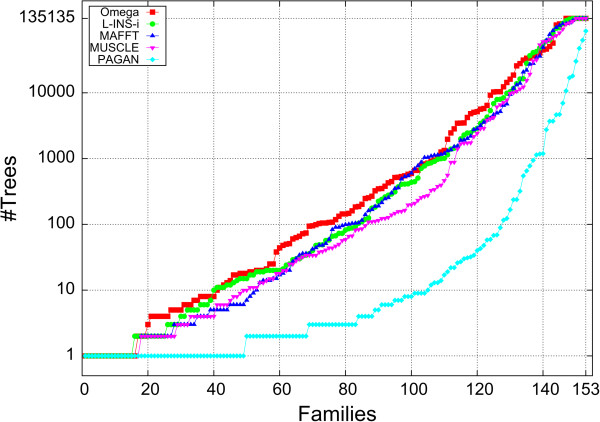
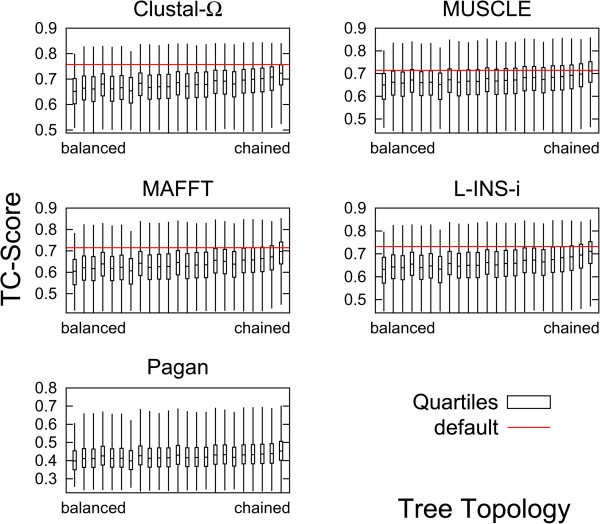
Results: We explore all possible guide-trees for a set of protein alignments of up to eight sequences. We find that pairwise distance based default guide-trees sometimes outperform evolutionary guide-trees, as measured by structure derived reference alignments. However, default guide-trees fall way short of the optimum attainable scores. On average chained guide-trees perform better than balanced ones but are not better than default guide-trees for small alignments.

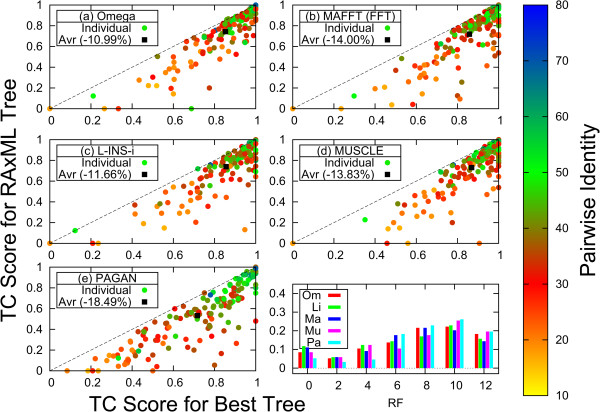
Conclusions: Alignment methods that use Consistency or hidden Markov models to make alignments are less susceptible to sub-optimal guide-trees than simpler methods, that basically use conventional sequence alignment between profiles. The latter appear to be affected positively by evolutionary based guide-trees for difficult alignments and negatively for easy alignments. One phylogeny aware alignment program can strongly discriminate between good and bad guide-trees. The results for randomly chained guide-trees improve with the number of sequences.


Figures

Figure 1
Figure 1
Comparison of TC Scores for default and ML tree. TC scores for default tree along x-axis, for phylogenetic tree along y-axis for (a) Clustal Omega, (b) MAFFT FFT-NS-i, (c) MAFFT L-INS-i, (d) MUSCLE. Colour dots are used for individual protein families: Blue and green for high percentage identity reference alignments, yellow and red for low identity. Black box is used for average TC score. Below the dotted line the default tree is better than the ML tree, above the ML tree is better than the default tree.
Figure 2
Figure 2
Comparison of TC Scores for default and best tree. TC scores for best tree along x-axis, for default tree along y-axis for (a) Clustal Omega, (b) MAFFT FFT-NS-i, (c) MAFFT L-INS-i, (d) MUSCLE. Colour dots are used for individual protein families: Blue and green for high percentage identity reference alignments, yellow and red for low identity. Black box is used for average TC score. Here all points must be below bisectrix as no tree can be better than the best tree.
Figure 3
Figure 3
Comparison of results for best possible and ML tree. TC scores for the best tree along x-axis, for ML tree along y-axis for (a) Clustal Omega, (b) MAFFT FFT-NS-i, (c) MAFFT L-INS-i, (d) MUSCLE, (e) PAGAN. Colour dots results are used for individual families, black squares averages of families. Bottom right-hand panel distribution of Robinson-Foulds distances between best and ML tree. Frequencies for Clustal Omega (Om) shown in red, MAFFT L-INS-i (Li) in green, MAFFT FFT-NS-i (Ma) in dark blue, MUSCLE (Mu) in magenta and PAGAN (Pa) in light blue.
Figure 4
Figure 4
Effect of branch length variability on default and optimum tree shape. Panel (a) correlates variability of distances with the degree of imbalance for the default tree. Families are represented with dots, the colour encoding the Colless score. Panel (b) correlates variability of distances with the degree of imbalance for an optimum tree. Families represented by the same colour as in panel (a).
Figure 5
Figure 5
Number of trees that produce optimum TC score. Along the x-axis number of families with no more trees producing optimum TC score than indicated along y-axis. Clustal Omega shown with red boxes, MAFFT L-INS-i with green bullets, MAFFT FFT-NS-i with dark blue triangles, MUSCLE with inverted magenta triangles, PAGAN with pale blue diamonds.
Figure 6
Figure 6
Quartiles of TC scores for different tree topologies. Tree topology along the x-axis, left-most box for perfectly balanced tree, right-most box for perfectly chained tree, intermediate topologies as specified in Additional file 1: Supplement S6. Whiskers represent top/bottom 25% scores, band represents median score. Boxes are averages over all 153 protein families. Red horizontal line shows average default score.

References

    1. Needleman SB, Wunsch CD. A general method applicable to the search for similarities in the amino acid sequence of two proteins. J Mol Biol. 1970;48(3):443–453. doi: 10.1016/0022-2836(70)90057-4. - DOI - PubMed
    1. Feng DF, Doolittle RF. Progressive sequence alignment as a prerequisite to correct phylogenetic trees. J Mol Evol. 1987;25(4):351–360. doi: 10.1007/BF02603120. - DOI - PubMed
    1. Higgins DG, Bleasby AJ, Fuchs R. CLUSTAL V: improved software for multiple sequence alignment. Comput Appl Biosci. 1992;8(2):189–191. - PubMed
    1. Sievers F, Wilm A, Dineen D, Gibson TJ, Karplus K, Li W, Lopez R, McWilliam H, Remmert M, Söding J, Thompson JD, Higgins DG: Fast, scalable generation of high-quality protein multiple sequence alignments using clustal omega.Mol Syst Biol 2011.,7(539): doi:10.1038/msb.2011.75 - PMC - PubMed
    1. Katoh K, Misawa K, Kuma K, Miyata T. Mafft: a novel method for rapid multiple sequence alignment based on fast fourier transform. Nucleic Acids Res. 2002;30:3059–3066. doi: 10.1093/nar/gkf436. - DOI - PMC - PubMed

Publication types

LinkOut - more resources