. 2015 May;230(5):1064-74.
doi: 10.1002/jcp.24835.

Amyloid precursor protein (APP) affects global protein synthesis in dividing human cells

Affiliations

Amyloid precursor protein (APP) affects global protein synthesis in dividing human cells

Anna Sobol et al. J Cell Physiol. 2015 May.

Abstract

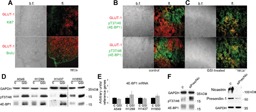
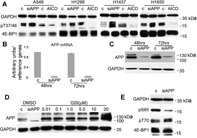
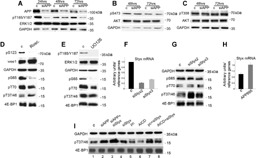
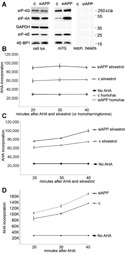
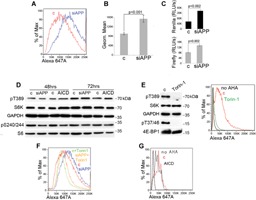
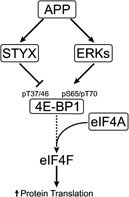
Hypoxic non-small cell lung cancer (NSCLC) is dependent on Notch-1 signaling for survival. Targeting Notch-1 by means of γ-secretase inhibitors (GSI) proved effective in killing hypoxic NSCLC. Post-mortem analysis of GSI-treated, NSCLC-burdened mice suggested enhanced phosphorylation of 4E-BP1 at threonines 37/46 in hypoxic tumor tissues. In vitro dissection of this phenomenon revealed that Amyloid Precursor Protein (APP) inhibition was responsible for a non-canonical 4E-BP1 phosphorylation pattern rearrangement-a process, in part, mediated by APP regulation of the pseudophosphatase Styx. Upon APP depletion we observed modifications of eIF-4F composition indicating increased recruitment of eIF-4A to the mRNA cap. This phenomenon was supported by the observation that cells with depleted APP were partially resistant to silvestrol, an antibiotic that interferes with eIF-4A assembly into eIF-4F complexes. APP downregulation in dividing human cells increased the rate of global protein synthesis, both cap- and IRES-dependent. Such an increase seemed independent of mTOR inhibition. After administration of Torin-1, APP downregulation and Mechanistic Target of Rapamycin Complex 1 (mTORC-1) inhibition affected 4E-BP1 phosphorylation and global protein synthesis in opposite fashions. Additional investigations indicated that APP operates independently of mTORC-1. Key phenomena described in this study were reversed by overexpression of the APP C-terminal domain. The presented data suggest that APP may be a novel regulator of protein synthesis in dividing human cells, both cancerous and primary. Furthermore, APP appears to affect translation initiation using mechanisms seemingly dissimilar to mTORC-1 regulation of cap-dependent protein synthesis.


Figures

Figure 1
Figure 1
GSI treatment causes increased 4E‐BP1 phosphorylation at T37/46 in hypoxic NSCLC. A: Hypoxic tumor microenvironment is quiescent. Top: coimmunofluorescence of GLUT‐1 (red) and Ki67 (green). Bottom: in vivo BrdU incorporation (green) and GLUT‐1 (red). Note that at this stage, lungs of mice contain 93 ± 0.8% human cancer cells (Eliasz et al., 2010). B: Control mice. C: GSI‐treated mice. Red: GLUT‐1; green, phosphorylated T37/46 4E‐BP1‐specific antibody. Note color segregation in control animals and co‐localization in GSI‐treated animals. D: Immunoblot of the specified proteins and phosphoproteins in total cell lysates obtained from the indicated cell lines after exposure to either DMSO (c) or GSI. In cell lines A549, H1299 and H1650 the intensity of the total 4E‐BP1 bands seems to increase because the three isoforms (α, β, γ, corresponding to 4E‐BP1 phosphorylated at T37/46, T37/46 plus T70, and T37/46 plus T70 and S65, respectively; Gingras et al., 2001) merge into one or two bands, indicating loss of 4E‐BP1 phosphorylation at S65 and/or T70 after GSI treatment. E: Q‐PCR experiments performed on total RNA extracted from cells exposed to DMSO vehicle (c) or GSI for 48 h. Columns represent averages of three independent experiments, bars represent S.D. Reference genes: RPL13, β‐actin, β‐globin. F: Left, representative immunoblot of the specified proteins and phosphoproteins in total cell lysates obtained from cell line H1299 after transfection with either a control siRNA (c), or cells transfected with siRNA to preselinin‐1 and nicastrin (siPres/Nic); right, immunoblot of the specified proteins. Similar results were obtained in cell lines A549 and H1437.
Figure 2
Figure 2
APP depletion causes 4E‐BP1 phosphorylation pattern rearrangements. A: Immunoblot of the specified proteins and phosphoproteins in total cell lysates obtained from the indicated cell lines after transfection with either a control siRNA or control plasmid (c), and cells transfected with siRNA to APP (siAPP) or with a plasmid encoding AICD (AICD). Artificial APP downregulation in NSCLC cells using siRNA: B: Q‐PCR. Columns represent the average of four independent experiments (one in each cell line A549, H1299, H1437, and H1650); bars represent S.D. The mRNA abundance for cells transfected with control siRNA (c) was arbitrarily set to 1 at 48 h after transfection. C: Representative immunoblot at the specified time‐points after siRNA transfection (cell line H1299). Virtually identical results were obtained in all cells tested. For the results shown here we used siRNA to APP 10 (Qiagen). The band visible in siAPP lanes is either non‐specific or, less probably, the highly APP homolog APLP‐2. That band was not affected by GSI treatment, and its intensity or presence was not consistently reproducible in our immunoblots. For these reasons we tend to consider it a non‐specific band. D: Immunoblot of the specified proteins in total cell lysates obtained from cell line H1299 after exposure to the indicated concentrations of GSI. DMSO‐treated cells were transfected with either control (c) or siRNA to APP. E: Immunoblot of the specified proteins and phosphoproteins in total cell lysates obtained from cell line H1299 48 h after transfection with either a control siRNA, or with a siRNA to APP. Similar results were obtained in multiple experiments and in cell line A549.
Figure 3
Figure 3
Artificial downregulation of APP causes a reduced ERKs activation but it does not affect Akt‐1 activation. APP modulates 4E‐BP1 phosphorylation through Styx. A‐C: Western blot analyses of the indicated proteins and phosphoproteins at the indicated time‐points in H1299 cells with depleted APP (siAPP) or in control siRNA‐transfected cells (c). Similar results were obtained in cell lines A549 and H1437. D: Immunoblot of the indicated protein and phosphoproteins in cell lysates obtained from cell line H1299 48 h after exposure to vehicle (c) or roscovitine (Rosc.). E: Immunoblot of the indicated protein and phosphoproteins in cell lysates obtained from cell line H1299 after exposure to vehicle (c) or UO126. In this experiment we show the 24 h time point because longer UO126 exposures caused paradoxical ERKs overactivation, as often described in scientific literature. F: Q‐PCR of the Styx mRNA in H1299 cells transfected with a control siRNA (c) or with the indicated siRNAs to Styx. Columns, averages of three independent experiments; bars, S.D. G: Western blot analysis of the indicated proteins and phosphoproteins 48 h after transfection of the indicated siRNAs. H: Q‐PCR of the Styx mRNA in cells transfected with the control plasmid pCAX (c) or with APP 695 cloned in pCAX (APP695). Columns represent averages of independent experiments performed in A549, H1299, and H1650 cells; bars represent S.D. I: Western blot analysis of the indicated protein and phosphoproteins in H1299 48 h after transfection with a variety of nucleic acids. Lanes: 1, cells transfected with siRNA control (c); 2, cells transfected with siRNA to APP (siAPP); 3, cells transfected with siRNA to APP and siRNA to Styx (siAPP + siStyx); 4, cells transfected with siRNA to Styx (siStyx); 5, cells transfected with control plasmid (pc); 6, cells transfected with a plasmid encoding AICD (AICD); 7, cells transfected with the control plasmid and siRNA to Styx (pc + siStyx); 8, cells transfected with a plasmid encoding AICD and with siRNA to Styx (AICD + siStyx). The apparent additive effect of siAPP and siStyx (lane 3) can be explained by a synergistic effect of the two treatments on the Styx mRNA expression level. APP forced expression, on the other hand, elevates the Styx mRNA expression levels (Fig. 3H). The fact that relatively small variations of the Styx mRNA level can produce measurably different effects on the 4E‐BP1 phosphorylation level at T37/46 is supported by the comparisons between siStyx2 and siStyx3 (Fig. 3F). SiStyx3 seems slightly less efficient in downregulating the Styx mRNA compared to siStyx2. This small variation yields measurable differences in 4E‐BP1 phosphorylation at T37/46 as measured using Western blot analysis (Fig. 3G).
Figure 4
Figure 4
APP depletion enhances eIF‐4A recruitment on the cap; cells with depleted APP are partially resistant to silvestrol. A: Representative immunoblot of the specified proteins in total cell lysates (cell lys.) and in 7‐methylguanosine(m7G)‐sepharose pulled‐down proteins from cell extracts obtained from H1299 cells transfected with either a control siRNA (c), or a siRNA to APP. Seph. beads, sepharose beads control. Similar results were obtained in multiple experiments and in cell line A549. B: AHA incorporation at the indicated time‐points of cells transfected with either a control siRNA (c) or a siRNA to APP, exposed to 0.1 μM silvestrol or to 0.1 μM homoharringtonine (homohar.). C: As in (B) using 0.04 μM silvestrol. D: As in (B), but cells were exposed to vehicle only (no antibiotics). The graphs summarize three experiments performed in A549 cells. Similar results were obtained in H1299 cells. Bars represent S.D.
Figure 5
Figure 5
APP depletion increases the rate of global protein synthesis independently of mTOR. A: AHA (L‐azidohomoalanine) incorporation followed by FACS analysis of A549 cells after transfection with either control siRNA (red) or with a siRNA to APP (blue). B: Summary of the results of AHA incorporation in NSCLC cell lines A549, H1299, and H1650. Columns represent averages; bars represent S.D. Three experiments for each cell line are shown. C: Summary of nine dual luciferase experiments performed in three NSCLC cell lines (columns represent averages, bars represent S.D.). Luciferase light units were normalized for plasmid DNA content measured using Q‐PCR. D: Western blot analysis of the indicated proteins and phosphoproteins in H1299 cells transfected with the indicated nucleic acids. E: Torin‐1 completely suppresses mTORC‐1 markers of activation and protein synthesis; left, Western blot analysis of the indicated proteins and phosphoproteins in total cell lysates obtained from H1299 cells treated with DMSO (c), or with Torin‐1; right, AHA incorporation in H1299 exposed to DMSO control or Torin‐1. F: AHA incorporation in H1299 cells transfected with a control siRNA and exposed to DMSO (red), transfected with siRNA to APP and exposed to DMSO (blue), transfected with a control siRNA and exposed to Torin‐1 (light green), and transfected with siRNA to APP and exposed to Torin‐1 (light brown). G: AHA incorporation in H1299 cells transfected with pCDNA3 (c) or with AICD cloned in pCDNA3 (AICD). All nucleic acids were transfected by electroporation. Note that cells electroporated with plasmid DNA appear to incorporate substantially less AHA compared to cells electroporated with siRNAs only.
Figure 6
Figure 6
Simplified schematics summarizing key findings in this study. APP seems to positively regulate Styx expression at the transcriptional level. Styx appears to moderate phosphorylation at residues T37/46 of 4E‐BP1. On the other hand, APP sustains activation of ERKs, which support, directly and indirectly, phosphorylation of 4E‐BP1 S65 and T70. Upon APP depletion, the rearrangement of 4E‐BP1 phosphorylation pattern favors increased recruitment of eIF‐4A in eIF‐4F initiation complexes. This event leads to augmented rate of global protein synthesis.

References

    1. Bachmair A, Finley D, Varshavsky A. 1986. In vivo half‐life of a protein is a function of its amino‐terminal residue. Science 234:179–186. - PubMed
    1. Barr JE, Munyikwa MR, Frazier EA, Hinton SD. 2013. The pseudophosphatase MK‐STYX inhibits stress granule assembly independently of Ser149 phosphorylation of G3BP‐1. FEBS J 280:273–284. - PMC - PubMed
    1. Beckett C, Nalivaeva NN, Belyaev ND, Turner AJ. 2012. Nuclear signalling by membrane protein intracellular domains: The AICD enigma. Cell Signal 24:402–409. - PubMed
    1. Böhni R, Riesgo‐Escovar J, Oldham S, Brogiolo W, Stocker H, Andruss BF, Beckingham K, Hafen E. 1996. Autonomous control of cell and organ size by CHICO, a Drosophila homolog of vertebrate IRS1–4. Cell 97:865–875. - PubMed
    1. Bordeleau ME, Robert F, Gerard B, Lindqvist L, Chen SM, Wendel HG, Brem B, Greger H, Lowe SW, Porco JA, Jr , Pelletier J. 2008. Therapeutic suppression of translation initiation modulates chemosensitivity in a mouse lymphoma model. J Clin Invest 118:2651–2660. - PMC - PubMed

Publication types

MeSH terms

LinkOut - more resources