

microRNA regulation of mammalian target of rapamycin expression and activity controls estrogen receptor function and RAD001 sensitivity
- PMID: 25283550
- PMCID: PMC4203920
- DOI: 10.1186/1476-4598-13-229
microRNA regulation of mammalian target of rapamycin expression and activity controls estrogen receptor function and RAD001 sensitivity
Abstract
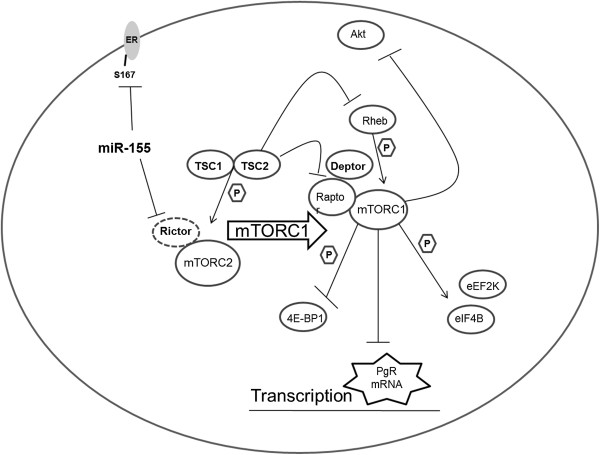
Background: The AKT/mammalian target of rapamycin (mTOR) signaling pathway is regulated by 17α-estradiol (E2) signaling and mediates E2-induced proliferation and progesterone receptor (PgR) expression in breast cancer.
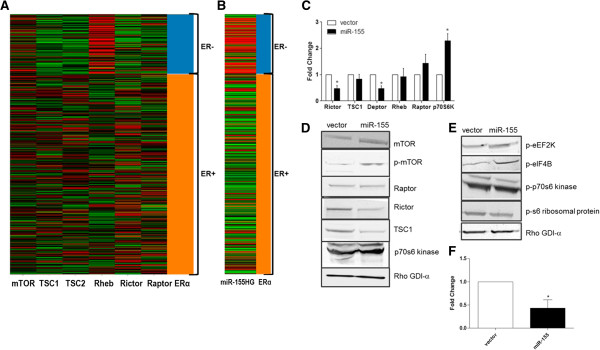
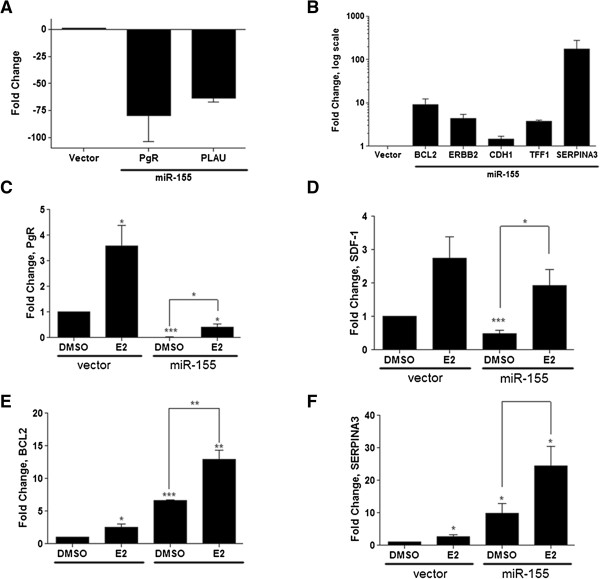
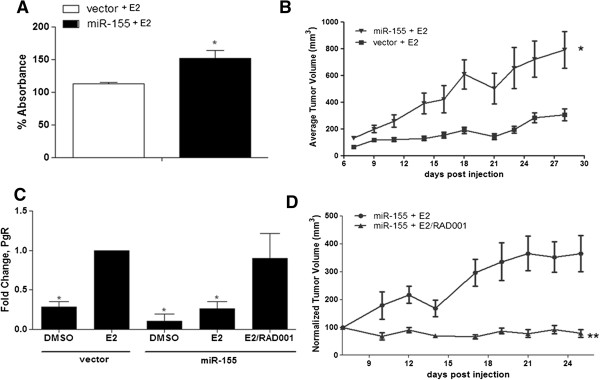
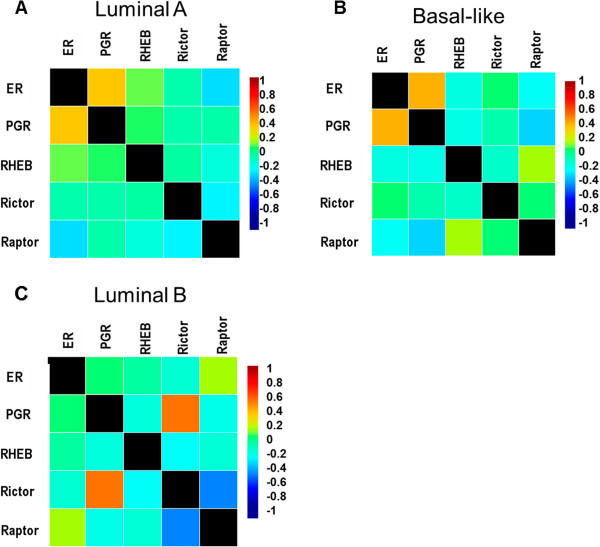
Methods and results: Here we use deep sequencing analysis of previously published data from The Cancer Genome Atlas to demonstrate that expression of a key component of mTOR signaling, rapamycin-insensitive companion of mTOR (Rictor), positively correlated with an estrogen receptor-α positive (ERα+) breast tumor signature. Through increased microRNA-155 (miR-155) expression in the ERα+ breast cancer cells we demonstrate repression of Rictor enhanced activation of mTOR complex 1 (mTORC1) signaling with both qPCR and western blot. miR-155-mediated mTOR signaling resulted in deregulated ERα signaling both in cultured cells in vitro and in xenografts in vivo in addition to repressed PgR expression and activity. Furthermore we observed that miR-155 enhanced mTORC1 signaling (observed through western blot for increased phosphorylation on mTOR S2448) and induced inhibition of mTORC2 signaling (evident through repressed Rictor and tuberous sclerosis 1 (TSC1) gene expression). mTORC1 induced deregulation of E2 signaling was confirmed using qPCR and the mTORC1-specific inhibitor RAD001. Co-treatment of MCF7 breast cancer cells stably overexpressing miR-155 with RAD001 and E2 restored E2-induced PgR gene expression. RAD001 treatment of SCID/CB17 mice inhibited E2-induced tumorigenesis of the MCF7 miR-155 overexpressing cell line. Finally we demonstrated a strong positive correlation between Rictor and PgR expression and a negative correlation with Raptor expression in Luminal B breast cancer samples, a breast cancer histological subtype known for having an altered ERα-signaling pathway.
Conclusions: miRNA mediated alterations in mTOR and ERα signaling establishes a new mechanism for altered estrogen responses independent of growth factor stimulation.
Figures
Similar articles
-
Impact of dual mTORC1/2 mTOR kinase inhibitor AZD8055 on acquired endocrine resistance in breast cancer in vitro.Breast Cancer Res. 2014 Jan 23;16(1):R12. doi: 10.1186/bcr3604. Breast Cancer Res. 2014. PMID: 24457069 Free PMC article.
-
The mechanistic target for rapamycin pathway is related to the phosphorylation score for estrogen receptor-α in human breast tumors in vivo.Breast Cancer Res. 2014 May 22;16(3):R49. doi: 10.1186/bcr3660. Breast Cancer Res. 2014. PMID: 24887419 Free PMC article.
-
Serum and glucocorticoid-regulated kinase 1 (SGK1) activation in breast cancer: requirement for mTORC1 activity associates with ER-alpha expression.Breast Cancer Res Treat. 2012 Sep;135(2):469-79. doi: 10.1007/s10549-012-2161-y. Epub 2012 Jul 29. Breast Cancer Res Treat. 2012. PMID: 22842983 Free PMC article.
-
Regulation of mTOR Signaling: Emerging Role of Cyclic Nucleotide-Dependent Protein Kinases and Implications for Cardiometabolic Disease.Int J Mol Sci. 2023 Jul 15;24(14):11497. doi: 10.3390/ijms241411497. Int J Mol Sci. 2023. PMID: 37511253 Free PMC article. Review.
-
Targeted Inhibition of Rictor/mTORC2 in Cancer Treatment: A New Era after Rapamycin.Curr Cancer Drug Targets. 2016;16(4):288-304. doi: 10.2174/1568009616666151113120830. Curr Cancer Drug Targets. 2016. PMID: 26563881 Review.
Cited by
-
Cell-type-specific translational control of spatial working memory by the cap-binding protein 4EHP.Mol Brain. 2023 Jan 18;16(1):9. doi: 10.1186/s13041-023-00995-2. Mol Brain. 2023. PMID: 36650535 Free PMC article.
-
Modulated Autophagy by MicroRNAs in Osteoarthritis Chondrocytes.Biomed Res Int. 2019 May 8;2019:1484152. doi: 10.1155/2019/1484152. eCollection 2019. Biomed Res Int. 2019. PMID: 31205933 Free PMC article. Review.
-
Loss of Hormone Receptor Expression after Exposure to Fluid Shear Stress in Breast Cancer Cell Lines.Int J Mol Sci. 2024 Jun 28;25(13):7119. doi: 10.3390/ijms25137119. Int J Mol Sci. 2024. PMID: 39000231 Free PMC article.
-
Lifetime Impact of Cow's Milk on Overactivation of mTORC1: From Fetal to Childhood Overgrowth, Acne, Diabetes, Cancers, and Neurodegeneration.Biomolecules. 2021 Mar 9;11(3):404. doi: 10.3390/biom11030404. Biomolecules. 2021. PMID: 33803410 Free PMC article. Review.
-
miR-155 induced transcriptome changes in the MCF-7 breast cancer cell line leads to enhanced mitogen activated protein kinase signaling.Genes Cancer. 2014 Sep;5(9-10):353-64. doi: 10.18632/genesandcancer.33. Genes Cancer. 2014. PMID: 25352952 Free PMC article.
References
-
- Dowling RJ, Topisirovic I, Alain T, Bidinosti M, Fonseca BD, Petroulakis E, Wang X, Larsson O, Selvaraj A, Liu Y, Kozma SC, Thomas G, Sonenberg N. mTORC1-mediated cell proliferation, but not cell growth, controlled by the 4E-BPs. Science. 2010;328:1172–1176. doi: 10.1126/science.1187532. - DOI - PMC - PubMed
-
- Gulhati P, Bowen KA, Liu J, Stevens PD, Rychahou PG, Chen M, Lee EY, Weiss HL, O'Connor KL, Gao T, Evers BM. mTORC1 and mTORC2 regulate EMT, motility, and metastasis of colorectal cancer via RhoA and Rac1 signaling pathways. Cancer research. 2011;71:3246–3256. doi: 10.1158/0008-5472.CAN-10-4058. - DOI - PMC - PubMed
Publication types
MeSH terms
Substances
Grants and funding
- P20 RR020152/RR/NCRR NIH HHS/United States
- CA125806/CA/NCI NIH HHS/United States
- R01 AI101046/AI/NIAID NIH HHS/United States
- P20 GM103518/GM/NIGMS NIH HHS/United States
- P20RR020152/RR/NCRR NIH HHS/United States
- R01 AI106676/AI/NIAID NIH HHS/United States
- U54 CA113001/CA/NCI NIH HHS/United States
- R01AI101046/AI/NIAID NIH HHS/United States
- NCI-U54 CA113001-07/CA/NCI NIH HHS/United States
- R01 CA138268/CA/NCI NIH HHS/United States
- R01 CA125806/CA/NCI NIH HHS/United States
- R01CA138268/CA/NCI NIH HHS/United States
- R01AI106676/AI/NIAID NIH HHS/United States
LinkOut - more resources
Full Text Sources
Other Literature Sources
Molecular Biology Databases
Research Materials
Miscellaneous
