. 2014 Nov;16(11):1045-56.
doi: 10.1038/ncb3045. Epub 2014 Oct 5.

Direct cell-cell contact with the vascular niche maintains quiescent neural stem cells

Affiliations

Direct cell-cell contact with the vascular niche maintains quiescent neural stem cells

Cristina Ottone et al. Nat Cell Biol. 2014 Nov.

Abstract

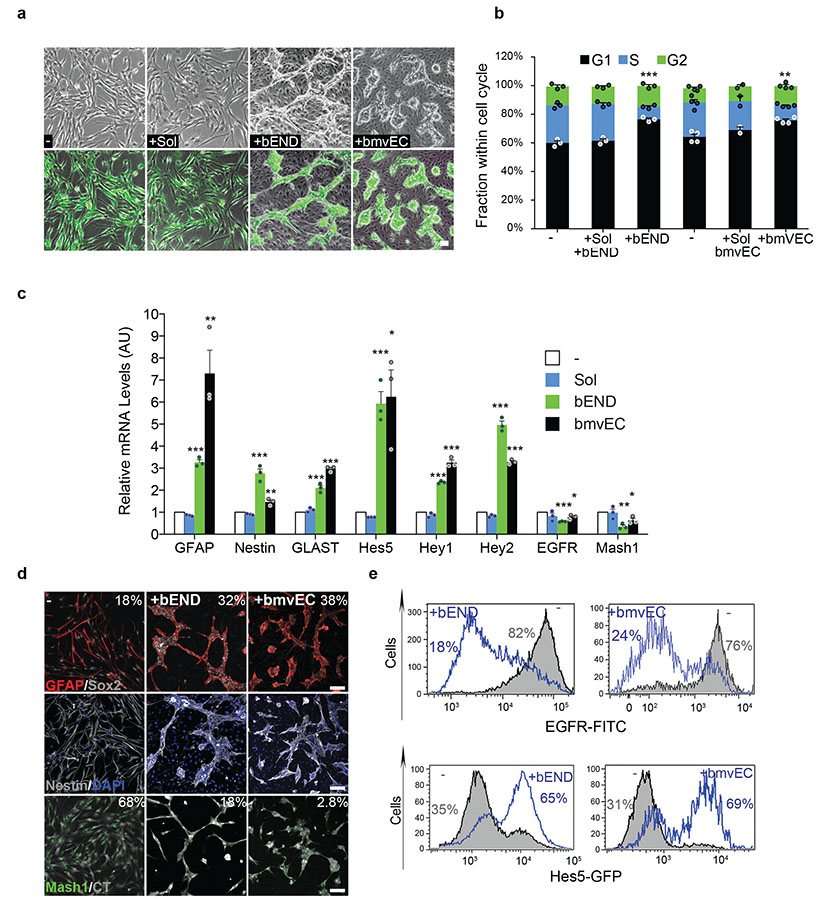
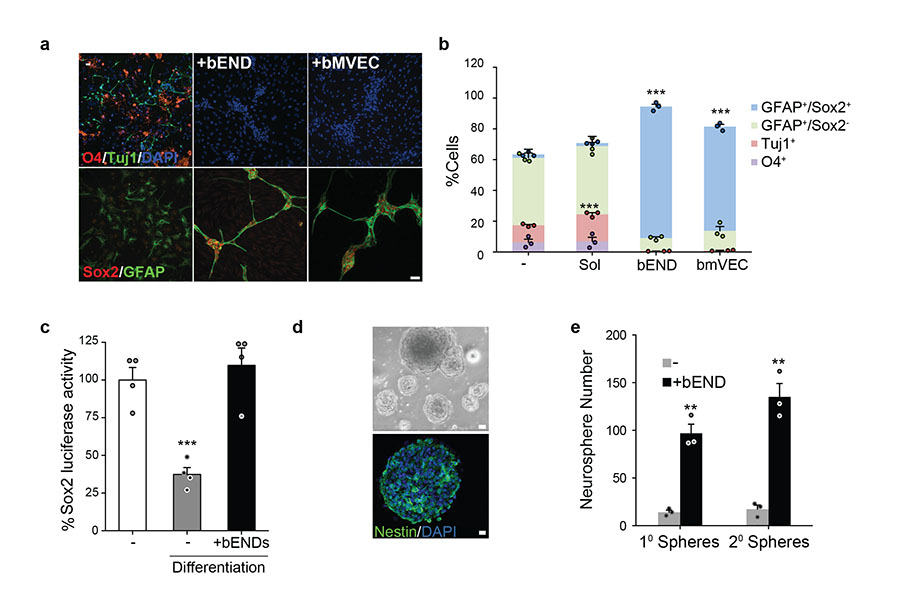
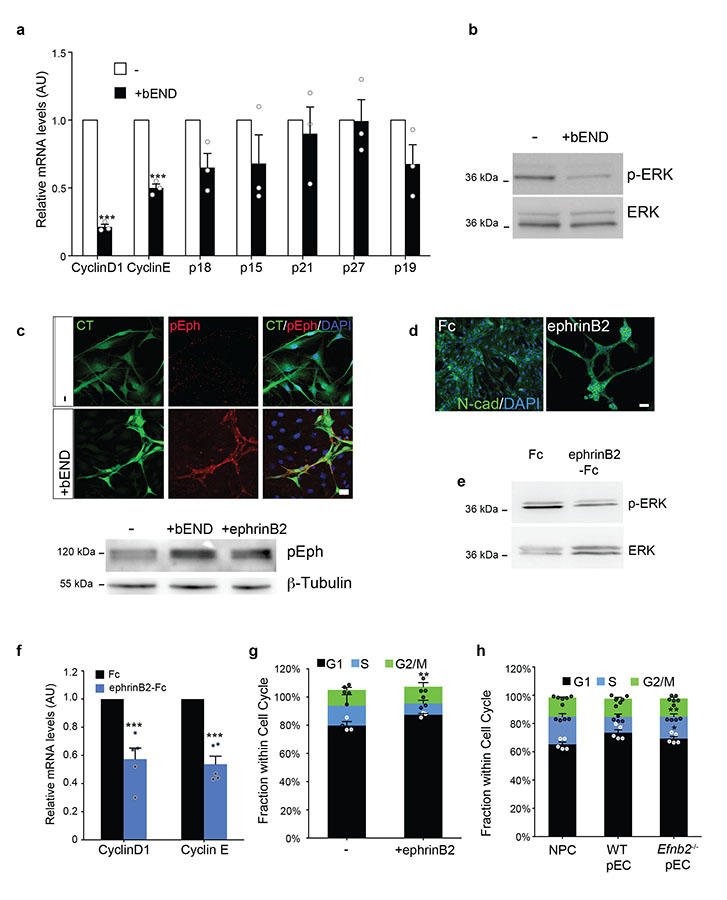
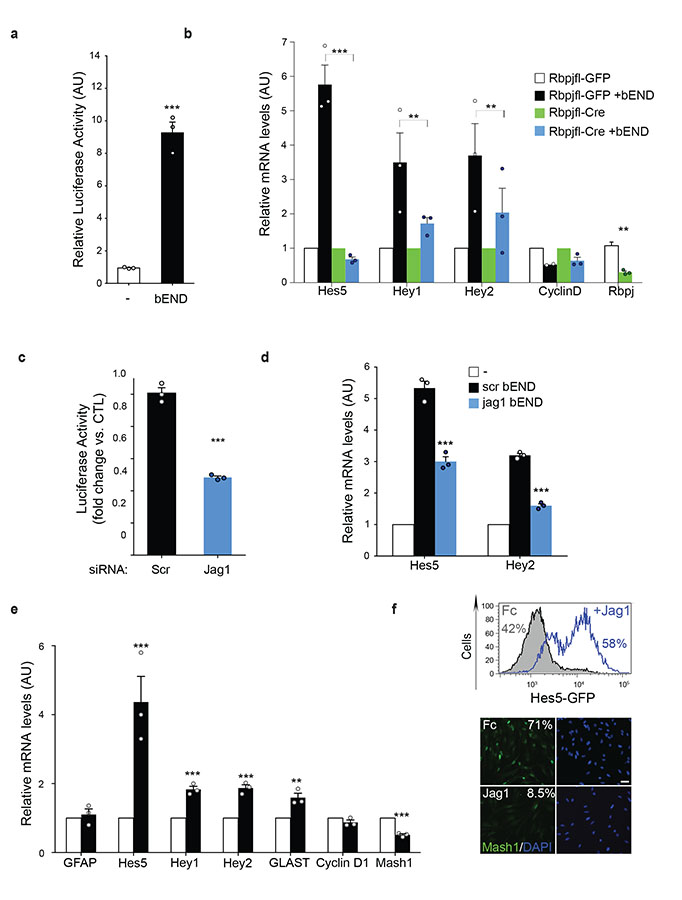
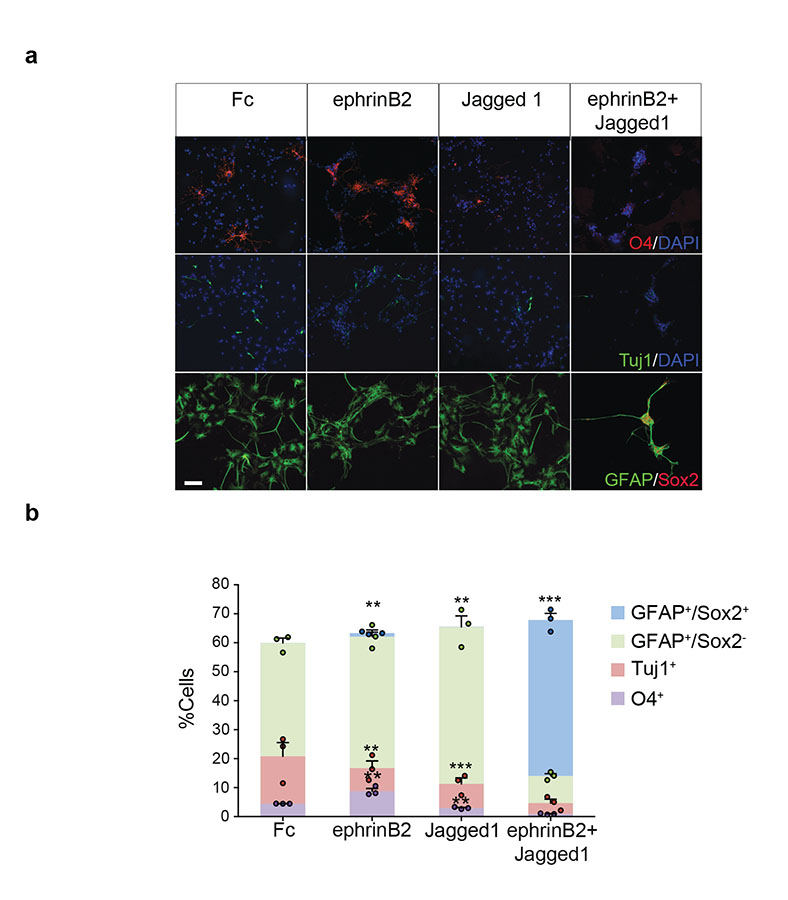
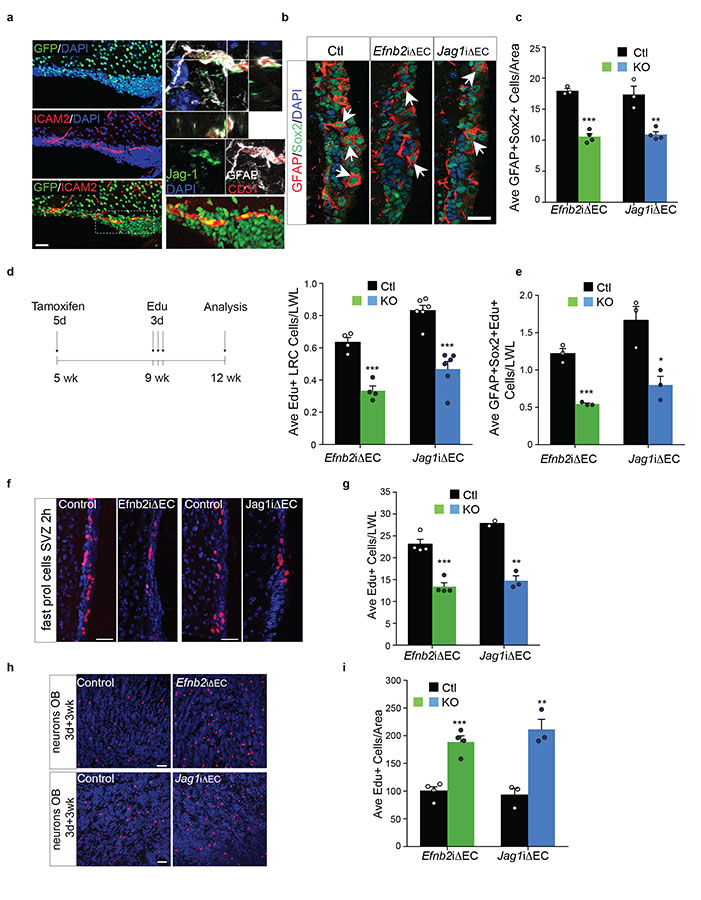
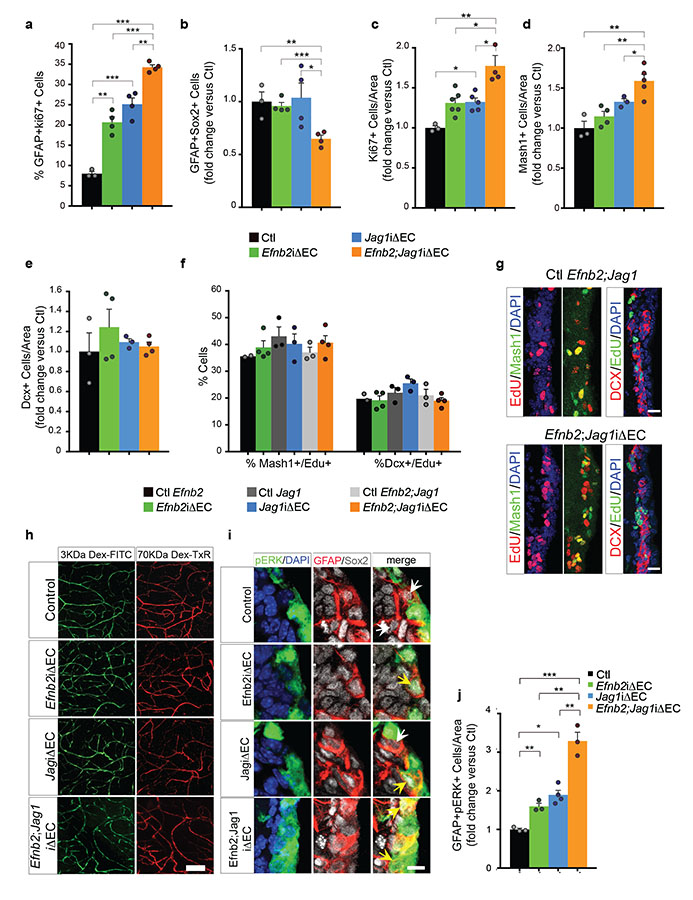
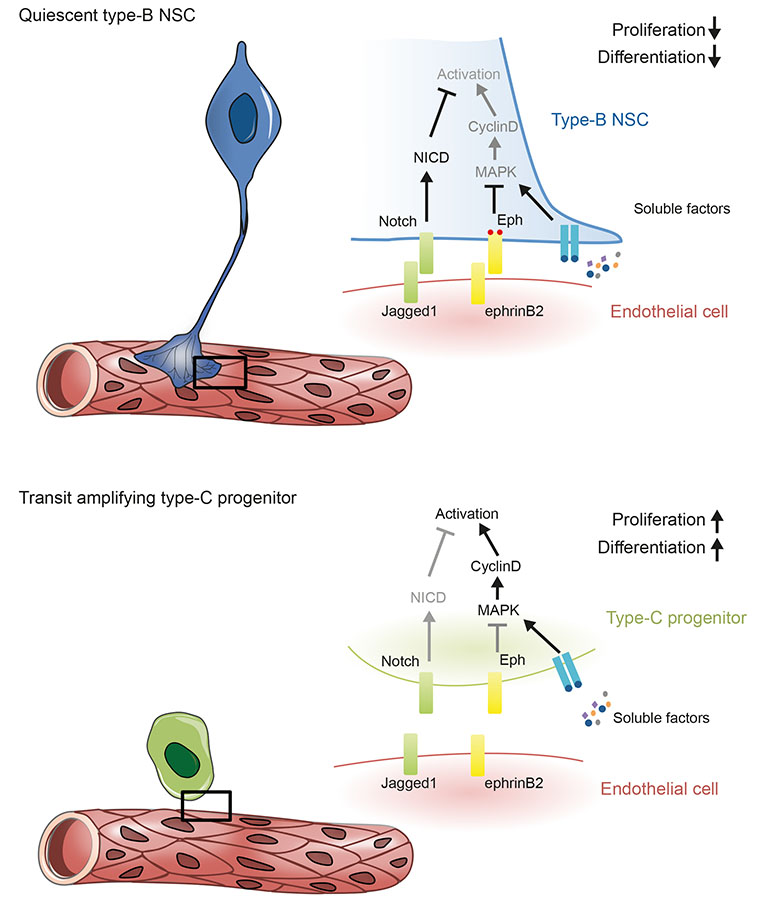
The vasculature is a prominent component of the subventricular zone neural stem cell niche. Although quiescent neural stem cells physically contact blood vessels at specialized endfeet, the significance of this interaction is not understood. In contrast, it is well established that vasculature-secreted soluble factors promote lineage progression of committed progenitors. Here we specifically investigated the role of cell-cell contact-dependent signalling in the vascular niche. Unexpectedly, we find that direct cell-cell interactions with endothelial cells enforce quiescence and promote stem cell identity. Mechanistically, endothelial ephrinB2 and Jagged1 mediate these effects by suppressing cell-cycle entry downstream of mitogens and inducing stemness genes to jointly inhibit differentiation. In vivo, endothelial-specific ablation of either of the genes which encode these proteins, Efnb2 and Jag1 respectively, aberrantly activates quiescent stem cells, resulting in depletion. Thus, we identify the vasculature as a critical niche compartment for stem cell maintenance, furthering our understanding of how anchorage to the niche maintains stem cells within a pro-differentiative microenvironment.


Figures

Figure 1
Figure 1. Endothelial cell contact enforces neural stem cell quiescence and promotes stem cell identity
(a) Phase contrast and fluorescence images of cell-tracker labelled (green) SVZ cells cultured alone (−), in the presence of endothelial cell-secreted soluble factors (+Sol) and in direct co-culture with indicated endothelial cells (+bEND, +bmvEC). Cultures were imaged 24h after seeding. Merged images are shown for clear identification of the NPC in mixed cultures. (b) Quantification of PI-BrdU FACS profiles of cultures described in (a) following a 1 hour BrdU pulse. For this and all later experiments NPC were separated from endothelial cells prior to analysis (n=3 dishes from independent experiments for all bEND, n=2 for Sol bmvEC transwell and n=4 for bmvEC cocultures). Error bars denote s.e.m. One-way ANOVA with Bonferroni correction. (c) Quantitative RT-PCR analysis of mRNA levels of type-B and type-C marker genes in the indicated culture conditions expressed as fold change relative to control NPC monocultures (n=3 RNA extract from independent experiments). Error bars denote s.d. One-way ANOVA with Bonferroni correction. (d) Representative immunofluorescence images of NPC seeded alone (−) or in coculture with endothelial cells (+bEND, +bmvEC) for 24h and stained for the indicated type-B and type-C markers. All numbers embedded in the figures indicate the percentage of marker positive cells in each condition. (e) Representative FACS profiles and quantification of EGFR positive cells in the same cultures as in (d). (f) FACS plots and quantification of GFP+ NPCs isolated from Hes5-GFP reporter mice and cultured as in (d). For these and all later experiments for which n<5, individual data point are shown as dots. Source data in Supplementary table 1. For this and all later figures ***=p<0.001, **=p<0.01, *=p<0.05. Scale bars: a=30μm; d=75μm
Figure 2
Figure 2. Endothelial cells inhibit differentiation through direct cell-cell contact
(a) Representative immunofluorescence images of neural stem cells seeded alone (−), or in direct co-culture with endothelial cells (+bEND, +bmvEC), induced to differentiate for 4 days and stained for the indicated proteins. (b) Quantification of neurons (Tuj1+), oligodendrocytes (O4+), astrocytes (GFAP+Sox2) and type-B-like stem cells (GFAP+Sox2+) in the conditions depicted in the conditions depicted in panel a and in transwell co-culture (+Sol) (n=3 independent experiments each pooled from duplicate cultures). For each experiment a minimum of 200 cells across randomly selected fields of view was counted. Error bars denote s.e.m. One-way ANOVA with Bonferroni correction. (c) Sox2 promoter activity of NPCs transiently expressing luciferase reporter constructs cultured in factors or in differentiation media, either alone (−) or in the presence of endothelial cells (+bEND). Data are normalized to control cultures and expressed as mean±s.e.m. (n=4 experiments each pooled from triplicate lysates). Two-tailed paired Student’s t-test. (d) Neurosphere formation assay. Following differentiation, NPC cultured alone (−) or with bEND were dissociated and seeded in suspension to assess neurosphere forming potential. Representative phase contrast images (top) and immunofluorescence image (bottom) of neurospheres derived from NPC+bEND cultures stained for the pluripotency marker nestin (green) and counterstained for DAPI (blue). (e) Quantification of neurospheres formed from differentiated NPC monocultures (−) or cocultured with bEND (bEND). (n=3 experiments each pooled from duplicate dishes). Error bars denote s.e.m. Two-tailed paired Student’s t-test. Each dot represents an independent experiment. Source data in Supplementary table 1. Scale bars: a=50μm; d=20μm.
Figure 3
Figure 3. Neural precursor cell proliferation on endothelial cells is inhibited by ephrinB2 ligands
(a) Quantitative RT-PCR analysis of mRNA levels of the indicated cell-cycle regulators in NPC cultured on their own (−) or together with endothelial cells (+bEND) in growth media for 24h (n=3 RNA extracts from independent experiments). Error bars denote s.d. Two-tailed paired Student’s t-test. (b) Western blot analysis of p-ERK and total ERK levels in NPC cultured alone (−) or with endothelial cells (+bEND) for 24h under the same conditions. (c) Top: Representative immunofluorescence images of cell-tracker labelled (green) NPC in monoculture or co-culture with endothelial cells (unlabelled) and pure endothelial cell control cultures stained for p-Eph (red). Nuclei were counterstained with DAPI (blue). Bottom: western analysis of pEph levels in NPC cultured alone (−), on bEND or ephrinB2-Fc for 24h, β-tubulin is used as loading control. (d) Immunofluorescence staining for N-cadherin (green) of NPC seeded on clustered ephrinB2-Fc ligands or Fc controls. (e) Western analysis of p-ERK and total ERK levels in NPC cultured on ephrinB2-Fc or Fc ligands for 24h. (f) Quantitative RT-PCR analysis of cyclinD1 and cyclinE mRNA levels in NPC stimulated with ephrinB2-Fc or Fc proteins (n=5 RNA extracts from independent experiments). Error bars denote s.d. Two-tailed paired Student’s t-test. (g) Quantification of NPC cell cycle profiles by FACS. Cells were seeded on Fc or ephrinB2-Fc for 24h and pulsed with BrdU for 1h (n=3 dishes from independent experiments). Error bars denote s.e.m. Each dot represents an independent experiment. One-way ANOVA with Bonferroni correction. (h) Quantification of FACS cell cycle profiles of NPC in monoculture (−) or coculture with wild type (+WT pEC) or Efnb2 knock-out (Efnb2−/− pEC) endothelial cells, measured by FACS (n=5 independent experiments). Error bars denote s.e.m. One-way ANOVA with Bonferroni correction. Source data in Supplementary table 1. Scale bars: c=30μm; d=50μm. Uncropped images of blots are shown in Supplementary Fig. 7.
Figure 4
Figure 4. Endothelial Jagged1 ligands maintain the type-B phenotype
(a) Hes-5 promoter activity in NPC transiently transfected with luciferase reporter constructs and cultured either alone (−) or with endothelial cells (+bEND). (n=3 experiments each pooled from triplicate lysates). Two-tailed paired Student’s t-test. (b) Quantitative RT-PCR analysis of mRNA levels of stated Notch target genes and CyclinD in RBPJflox/flox NPC infected with Adeno-GFP or Adeno-Cre viruses and cultured alone or with endothelial cells (+bEND) (n=3 RNA extracts from independent experiments). Two-tailed paired Student’s t-test. (c) Hes-5 luciferase reporter activity in NPC cocultured with scrambled siRNA (Scr) or Jag1 knock-down bEND cells (n=3 experiments pooled from triplicate lysates). Two-tailed paired Student’s t-test. (d) Quantitative RT-PCR analysis of the indicated Notch target genes in NPC cultured in the absence (−) or presence of Scr siRNA-treated endothelial cells and in the presence of Jag1-knock down endothelial cells (n=3 RNA extracts from independent experiments). One-way ANOVA with Bonferroni correction. (e) Quantitative RT-PCR analysis of indicated Notch target genes in NPC cultured on Fc (Fc) control proteins or Jagged1-Fc (n=3 RNA extracts from independent experiments). Two-tailed paired Student’s t-test. All bar graphs show mean±SEM. Each dot represents an independent experiment. Source data in Supplementary table 1. (f) top: representative FACS analysis and quantification of GFP+ cells in Hes5-GFP reporter NPC cultures treated with Fc or Jagged1 (Jag1) ligands. Bottom: representative immunofluorescence images of Fc and Jagged1 treated NPCs stained for Mash1 (green) and DAPI (blue). Numbers indicate percentage of Mash1+ cells in these cultures. Scale bar=50μm.
Figure 5
Figure 5. Jagged1 and ephrinB2 jointly inhibit neuronal differentiation
(a) Representative immunofluorescence images of neural stem cells seeded on Fc controls, ephrinB2-Fc, Jagged1-Fc or both ligands as stated, differentiated for 4d and stained for the indicated markers and counterstained with DAPI. (b) Quantification of cultures shown in (a). Shown is the mean±s.e.m. of n = three independent experiments pooled from duplicate dishes. For each experiment a minimum of 200 cells across randomly selected fields of view was counted. One-way ANOVA with Bonferroni correction. Each dot represents an independent experiment. Source data in Supplementary table 1. Scale bar=100μm.
Figure 6
Figure 6. Vascular ephrinB2 and Jagged1 maintain neural stem cells in vivo
Analysis of SVZ neurogenesis 4 weeks after recombination. (a) Immunofluorescence staining for GFP (green) and the endothelial marker ICAM2 (red) in coronal section of the SVZ of Efnb2-GFP reporter mice (left) and Jagged1, GFAP and CD31 staining of coronal sections of wild type SVZ (right). Inset (bottom right) shows a higher magnification of a representative GFP-positive SVZ vessel. Lateral views show colocalisation of GFAP+ type-B cell processes with Jagged1+ vessels. (b) Representative immunofluorescence images of SVZs of Efnb2iΔEC, Jag1iΔEC and control tamoxifen-injected littermates (Ctl) stained for GFAP and Sox2 at 4 weeks post-recombination. (c) Quantification of GFAP+Sox2+ type-B cells in all genotypes at the same timepoint as b (Ctl n=3 animals; Jag1iΔEC n=4). (d) Schematic representation of EdU labelling regime (left) and quantification of total EdU label retaining cells (LRC, right, Ctl Efnb2 and Efnb2iΔEC n=4; Ctl Jag1 and Jag1iΔEC n=6). (e) Quantification of EdU+GFAP+Sox2+ label retaining cells labelled with EdU as depicted in d and stained for GFAP, Sox2 and EdU at the end of the EdU chase period (7 weeks, n=3 all genotypes). (f) Representative EdU staining of actively proliferating cells in the SVZ of Efnb2iΔEC, Jag1iΔEC and respective control littermates at 4 weeks post-recombination. (g) Quantifications of EdU staining in (f). (Ctl Efnb2 n=4, Efnb2iΔEC n=4; Ctl Jag1 n=2 and Jag1iΔEC n=3). (h) Representative immunofluorescence images and quantifications (i) of EdU staining of label retaining cells in the olfactory bulbs of the indicates genotypes (Ctl Efnb2 and Efnb2iΔEC n=4; Ctl Jag1 and Jag1iΔEC n=3). Data are normalized to the length of the SVZ lateral wall (LWL) or to SVZ-olfactory bulb area analysed as indicated and expressed as mean±SEM. Each dot represents a mouse. p values were calculated using the two-tailed paired Student’s t-test. Source data in Supplementary table 1. Scale bars: a=100μm; b=20μm; f=30μm; h=30μm.
Figure 7
Figure 7. Loss of ephrinB2 and Jagged1 prematurely activates quiescent type-B stem cells in the SVZ
Analysis of SVZ neurogenesis 10d after recombination. (a) Quantification of the percentage of activated GFAP+Ki67+ type-B cells in the SVZ of mice of indicated genotypes (Ctl n=3 animals and n=4 for all mutants). For this and all following graphs, only one representative control is depicted for clarity as all controls gave similar results. (b) Quantification of total GFAP+Sox2+ type-B cells. Values are expressed as fold change relative to respective tamoxifen-injected littermate controls (Ctl) to facilitate comparison across genotypes (Ctl n=3 and n=4 for all mutants). (c) Quantification of total Ki67+ cells normalised to controls (Ctl n=3, Efnb2iΔEC n=6, Jag1iΔEC n=5, Efnb2;Jag1iΔEC n=4). (d) Quantificaiton of total Mash1+ type-C cells. Values are expressed as fold change to controls (Ctl n=3; Efnb2iΔEC n=4, Jag1iΔEC n=3, Efnb2;Jag1iΔEC n=4). (e) Quantification of total DCX+ type-A cells. Values are expressed as fold change to controls (Ctl n=3; Efnb2iΔEC n=4, Jag1iΔEC n=3, Efnb2;Jag1iΔEC n=4). (f) Quantification of the percentage of EdU+ type-C (Mash1+) and type-A (DCX+) cells over total number of Mash1+ and DCX+ cells respectively, in the SVZs of all control and mutant mice (Ctl Efnb2 n=2, Efnb2iΔEC n=4, Ctl Jag1 n=3, Jag1iΔEC n=3, Ctl Efnb2;Jag1 n=3, Efnb2;Jag1iΔEC n=4). (g) Representative images of Mash1, DCX and EdU staining in Efnb2;Jag1iΔEC and Ctl SVZ. (h) Representative images of wholemount preparations of SVZs perfused intracardially with fixable fluorescent Dextrants of the indicated sizes. (i) Representative immunofluorescence images of SVZs of indicated genotypes stained for GFAP, Sox2 and pERK, white arrows indicate pERK negative and yellow arrows pERK positive type-B cells. (j) Quantification of staining in (e). Values are normalised to area and expressed as fold change over respective controls (Ctl n=3, Efnb2iΔEC n=3, Jag1iΔEC n=4, Efnb2;Jag1iΔEC n=3). All bars represent mean ±s.e.m. Each dot represents a mouse. For all quantifications shown p values were calculated using the two-tailed paired Student’s t-test. Source data in Supplementary table 1. Scale bars: g=25μm; h=75μm; i=15μm.
Figure 8
Figure 8. Model of vascular niche-regulated neurogenesis in the adult SVZ
(a) In the adult SVZ, quiescent type-B stem cells physically contact endothelial cells through specialized endfeet. This direct cell-cell interaction allows endothelial ephrinB2 and Jagged1 to respectively activate Eph and Notch signalling in type-B cells. Upon stimulation, Eph attenuates MAPK signalling induced by growth factors, thereby downregulating CyclinD levels to inhibit proliferation. In parallel, activation of Notch signalling by Jagged1 maintains quiescent type-B fate by modulating gene expression. (b) Type-C progenitors contact the endothelium more transiently and at smaller sites. This terminates Eph and Notch signalling, allowing the cells to activate MAPK in response to soluble cues and enter the cell-cycle to progress through the lineage.

References

    1. Fuchs E, Tumbar T, Guasch G. Socializing with the neighbors: stem cells and their niche. Cell. 2004;116:769–778. - PubMed
    1. Chen S, Wang S, Xie T. Restricting self-renewal signals within the stem cell niche: multiple levels of control. Current opinion in genetics & development. 2011;21:684–689. doi:10.1016/j.gde.2011.07.008. - PubMed
    1. Wagers AJ. The stem cell niche in regenerative medicine. Cell Stem Cell. 2012;10:362–369. doi:10.1016/j.stem.2012.02.018. - PubMed
    1. Doetsch F, Caille I, Lim DA, Garcia-Verdugo JM, Alvarez-Buylla A. Subventricular zone astrocytes are neural stem cells in the adult mammalian brain. Cell. 1999;97:703–716. - PubMed
    1. Ihrie RA, Alvarez-Buylla A. Lake-front property: a unique germinal niche by the lateral ventricles of the adult brain. Neuron. 2011;70:674–686. doi:10.1016/j.neuron.2011.05.004. - PMC - PubMed

Publication types

MeSH terms