. 2014 Oct 9;159(2):333-45.
doi: 10.1016/j.cell.2014.08.042. Epub 2014 Oct 2.

Coreceptor scanning by the T cell receptor provides a mechanism for T cell tolerance

Affiliations

Coreceptor scanning by the T cell receptor provides a mechanism for T cell tolerance

Ondrej Stepanek et al. Cell. .

Abstract

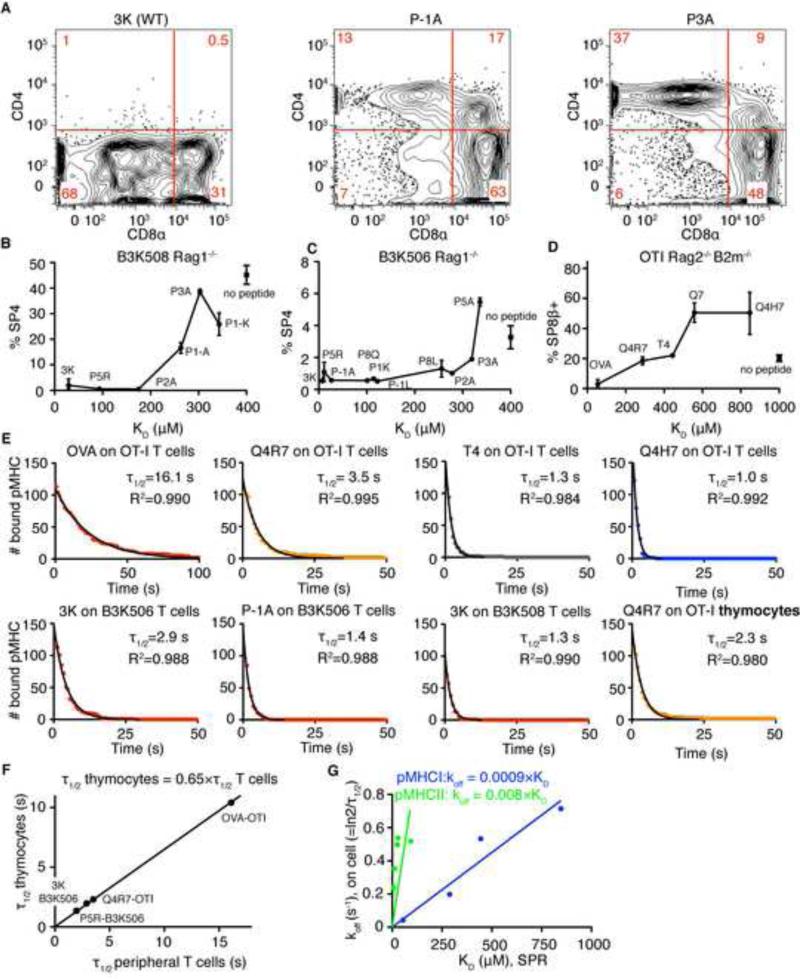
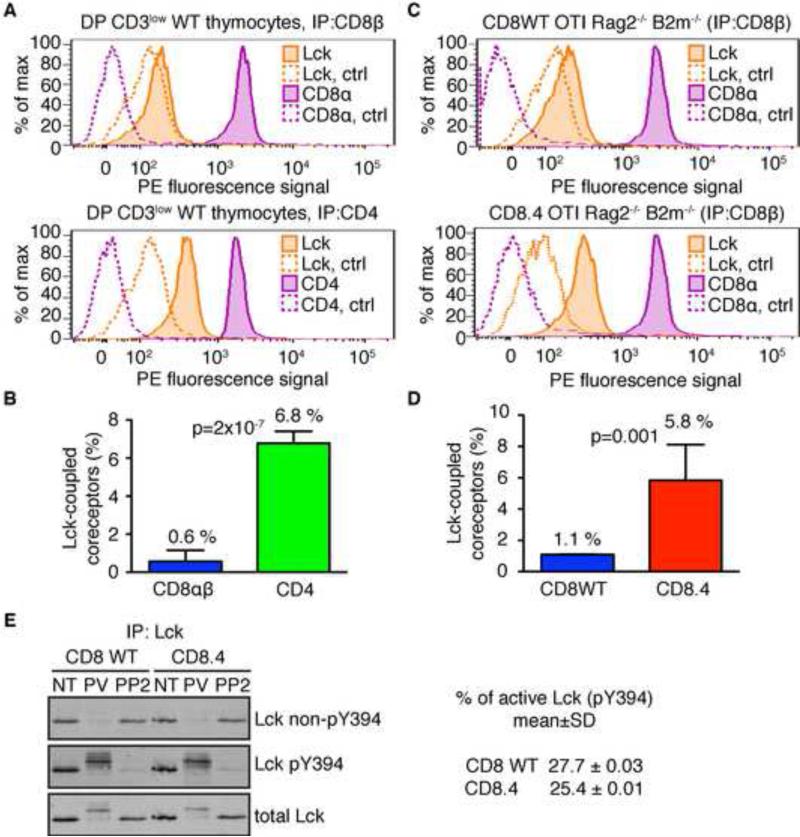
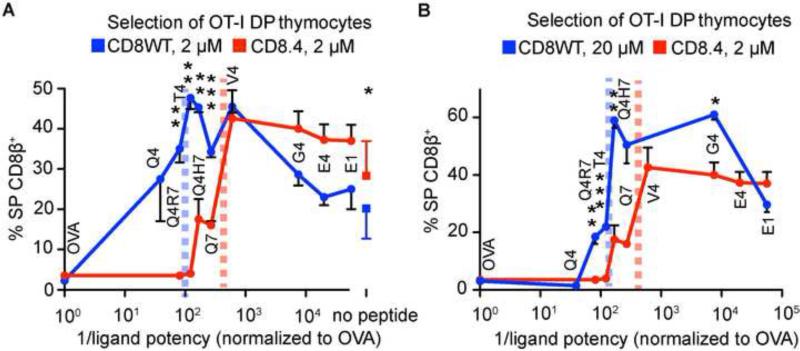
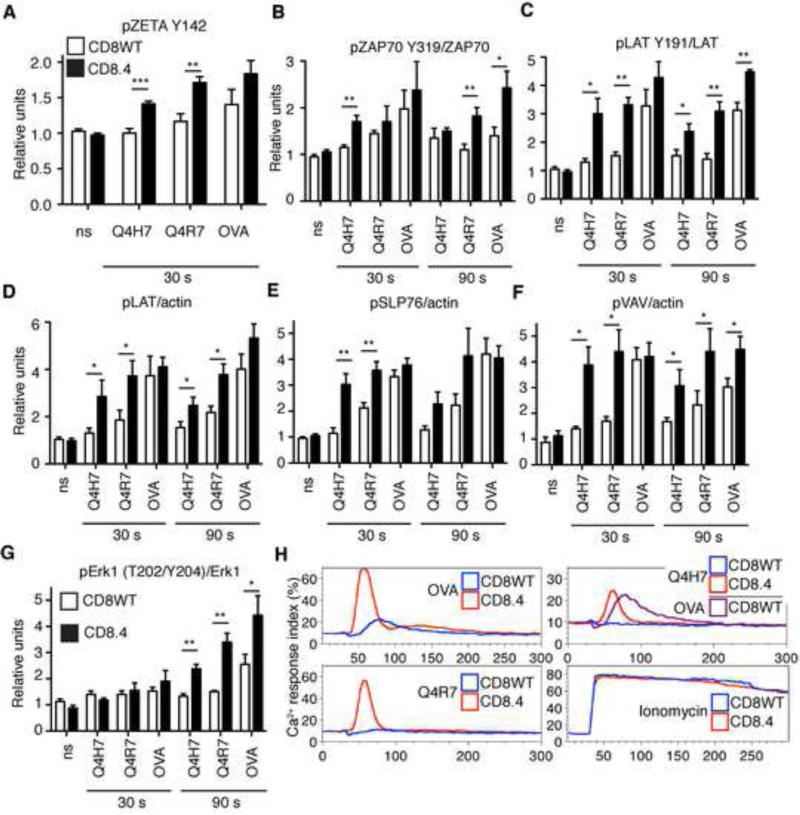
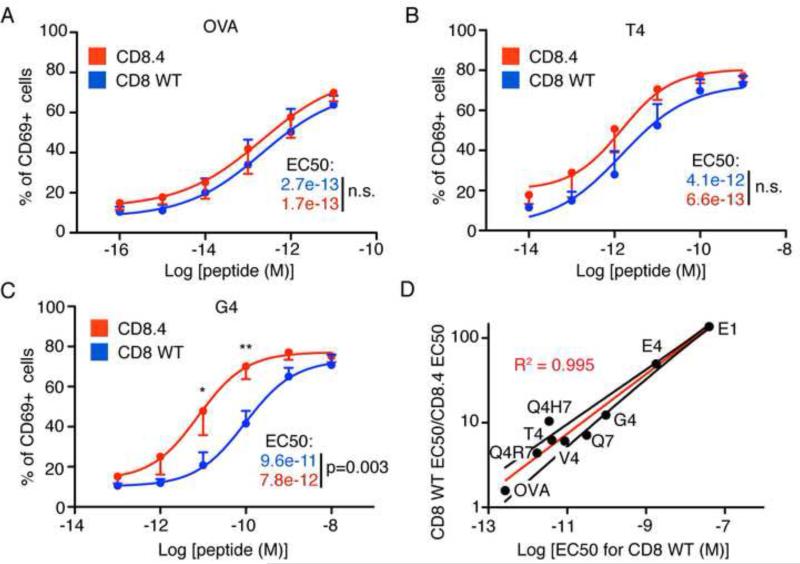
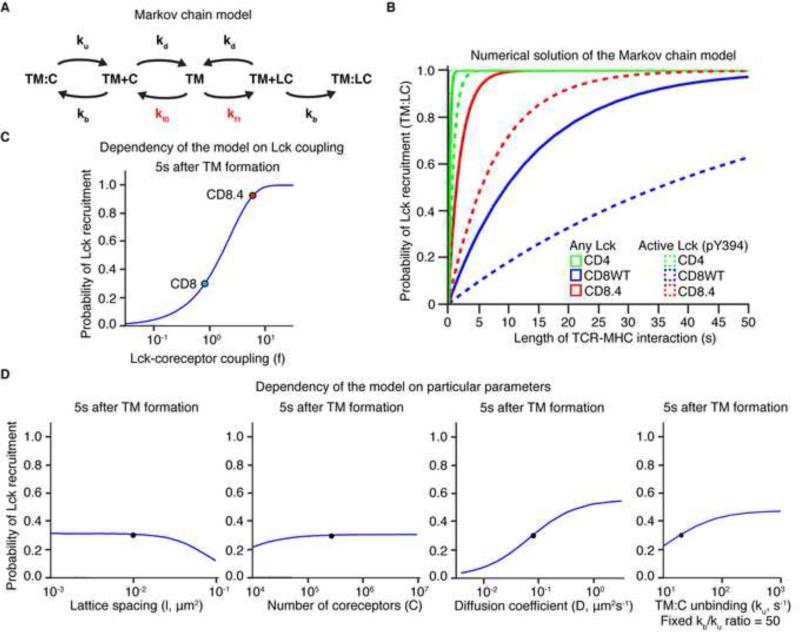
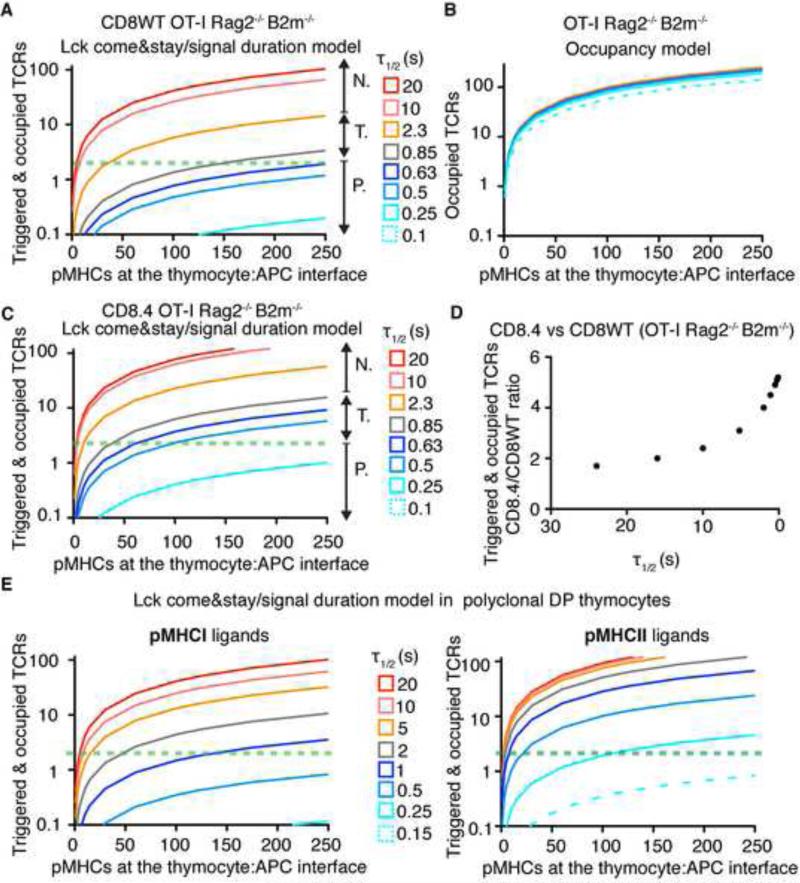
In the thymus, high-affinity, self-reactive thymocytes are eliminated from the pool of developing T cells, generating central tolerance. Here, we investigate how developing T cells measure self-antigen affinity. We show that very few CD4 or CD8 coreceptor molecules are coupled with the signal-initiating kinase, Lck. To initiate signaling, an antigen-engaged T cell receptor (TCR) scans multiple coreceptor molecules to find one that is coupled to Lck; this is the first and rate-limiting step in a kinetic proofreading chain of events that eventually leads to TCR triggering and negative selection. MHCII-restricted TCRs require a shorter antigen dwell time (0.2 s) to initiate negative selection compared to MHCI-restricted TCRs (0.9 s) because more CD4 coreceptors are Lck-loaded compared to CD8. We generated a model (Lck come&stay/signal duration) that accurately predicts the observed differences in antigen dwell-time thresholds used by MHCI- and MHCII-restricted thymocytes to initiate negative selection and generate self-tolerance.


Figures

Figure 1
Figure 1. Thresholds for negative selection by pMHCII and pMHCI ligands show similar SPR affinities but different on-cell dwell times
Fetal thymi from B3K508 Rag1−/− (A-B), B3K506 Rag1−/− (C), and OTI Rag2−/− β2m−/− mice (D) were cultured with different APLs (20 μM) for 7 days and stained for CD4 and CD8. (A) Effects of 3K, P1-A, and P3A on the B3K508 Rag1−/− thymocyte development. Each panel is a representative plot from 2 thymi. (B-D) Percentage of CD4 or CD8β single positive cells versus KD of APLs. Mean ± range, n=2-5. Square symbol shows percentage of single positive cells without peptide (mean ± SEM, n = 5-11). (E) Distribution of dwell times of pMHCI and pMHCII ligands on TCR transgenic CD4 or CD8 peripheral T cells, or preselection DP thymocytes. Data were fitted using one phase exponential decay curve. (F) τ1/2 on preselection thymocytes vs. τ1/2 on peripheral cells were plotted and fitted using linear regression with a fixed [0;0] point. (G) koff, calculated from on-cell τ1/2 on peripheral T cells vs. KD determined by SPR was plotted for pMHCI and pMHCII ligands and fitted with a linear regression with fixed [0;0] point. See also Figure S1 and Table S1.
Figure 2
Figure 2. Quantitative determination of Lck coupling to CD4, CD8, and CD8.4 coreceptors
Cell lysates were incubated with beads coated with antibodies to CD4, CD8β, or isotype controls. Beads were probed with PE-conjugated antibodies to Lck, CD8α, or CD4 and analyzed by flow cytometry. (A-B) Sorted DP CD3low thymocytes from WT mice were analyzed. (C-D) Thymocytes from CD8WT and CD8.4 OTI Rag2−/− β2m−/− mice were analyzed. Representative histograms (A, C) and aggregate data (B, D) (mean ± SD, n = 3-5) are shown. P values were calculated using Student's T test (2 tailed, unequal variance). See also Figure S2. (E) Lck was immunoprecipitated from lysates from nontreated (NT), pervanadate (PV), or 20 μM PP2 treated CD8WT and CD8.4 OTI Rag2−/− β2m−/− thymocytes. Phosphorylation of Lck was analyzed by Western blotting using simultaneous staining with Abs specific for phosphorylated or non-phosphorylated Y394. The membrane was re-probed with Ab to total Lck. Percentage of phosphorylated Lck molecules in resting CD8WT or CD8.4 DP thymocytes was calculated. CD8WT: n=4; CD8.4: n=5.
Figure 3
Figure 3. Enhanced Lck coupling lowers the threshold for negative selection
Fetal thymi from CD8WT and CD8.4 OT-I Rag2−/−β2m−/− mice were exposed to OVA derived APLs at the indicated concentrations Percentage of CD8β+ single positive cells versus 1/potency of the ligands (Daniels et al., 2006) is shown (mean ± SEM, n=2-7). The squares (A) show percentage of single positive cells generated with no peptide (mean ± SD, n = 11-12). The threshold for negative selection is marked by dashed vertical lines. Student's T test (2 tailed, unequal variance): *p<0.05, ** p<0.01, ***<0.001. See also Table S1.
Figure 4
Figure 4. CD8.4 enhances proximal signaling in OT-I thymocytes
(A-G) Thymocytes from CD8WT or CD8.4 OT-I Rag2−/−β2m−/− mice were stimulated with 100 nM Kb-OVA, -Q4R7, or -Q4H7 tetramers or left unstimulated (ns). Results were normalized to the average of signal from unstimulated CD8WT or CD8.4 cells in each experiment. (A) Phosphorylation of TCRζ (Y142) was analyzed by flow cytometry on CD4+CD8+ population. Mean ± SEM, n=6. (B-C, G) Phosphorylation of LAT, ZAP70, and Erk was analyzed using phospho-specific Abs. Reprobing the membranes for total ZAP70, LAT, and Erk served as respective loading controls. (D-F) Phosphorylation of LAT, SLP76, and VAV in whole cell lysates was determined using anti-pTyr Ab and anti-actin Ab. as a loading control by Western blotting. Mean ± SEM, n=4. Statistical significance was tested using student's T test (1 tailed, unequal variance): * p ≤ 0.05, ** p <0.01. See also Figure S3. (H) CD8WT or CD8.4 OT-I DP thymocytes were loaded with Indo-1 and stimulated with 200 nM Kb-OVA, -Q4R7, or -Q4H7 tetramers or 1.5 μM ionomycine. Calcium mobilization was analyzed by flow cytometry. Ca2+ response index is shown (see Extended Matherial and Methods). A representative experiment from a total of 3 is shown.
Figure 5
Figure 5. CD8.4 preferentially enhances response to weak ligands
Thymocytes from CD8WT and CD8.4 OT-I Rag2−/−β2m−/− mice were incubated with APCs loaded with varying concentrations of different peptides. After 24 hours, the percentage of CD69+ thymocytes was measured by flow cytometry. Response to OVA (A), T4 (B), and G4 (C) is shown. Mean ± SEM, n=4. Statistical significance was tested using Student's T test (1 tailed, unequal variance): * p<0.05, ** p<0.01. (D) CD69 response of CD8WT and CD8.4 OT-I DP thymocytes to different antigens was examined and EC50 values were calculated. Ratio of EC50 CD8WT/EC50 CD8.4 was plotted vs. EC50 CD8WT. Results show that CD8.4 thymocytes are preferentially more sensitive to weaker ligands, compared to CD8WT thymocytes. Red line shows the log-log line fit and the black lines represent 95% confidence intervals. See also Figure S4.
Figure 6
Figure 6. Markov chain model for Lck delivery to the TCR-pMHC pair
(A) Scheme of the Markov chain model describing kinetics of protein interactions in the plasma membrane. TM is a TCR-pMHC pair, C is an empty coreceptor, and LC is an Lck coupled coreceptor. TM+C and TM+LC represent coreceptor and TCR-pMHC pairs (in close proximity), TM:C and TM:LC represent coreceptor-TCR-pMHC complexes (binding). The complex of Lck-coupled coreceptor and TCR-pMHC (TM:LC) is an absorbing end state. KD, kb, ku, kf0, kf1 represent kinetic rates (Table S2). The rates that depend on the extent of coreceptor-Lck coupling are shown in red. (B) Numerical solution of Markov chain model. The probability of TM:LC complex formation as a function of time was calculated for CD4 (pMHCII), CD8WT (pMHCI), and CD8.4 (pMHCI). Both the probability of recruitment of any Lck-coupled coreceptor (solid line) or a coreceptor coupled to active Lck (pY394) is shown (dashed line). (C) Probability of TM:LC pair formation as a function of CD8-Lck coupling for MHCI ligand. The values for CD8WT (blue dot) and CD8.4 (red dot) are marked. Other parameters remained fixed. (D) The probabilities of TM:LC formation as a function of lattice spacing, coreceptors number, CD8 and TCR diffusion coefficient and CD8:MHC unbinding ku (when ku/kb ratio was fixed) for MHCI ligand and CD8 coreceptor. The original parameters are marked (black dot). See also Extended Material and Methods, Figure S5, and Table S2.
Figure 7
Figure 7. Model of Lck recruitment combined with kinetic proofreading predicts experimental data
Graphs show TCR signal intensity as a function of number of cognate ligands at the thymocyte/APC interface for different ligands (kon=0.1 μm2s−1, τ1/2 variable). Horizontal green dashed line shows the likely threshold when 2 TCRs are triggered and still occupied. (A) ‘Lck come&stay/signal duration’ model for CD8WT OT-I Rag2−/− β2m−/− thymocytes. N. negative selectors, T. threshold ligands (partial negative selectors), P. positive selectors. (B) Pure TCR occupancy model for OT-I Rag2−/− β2m−/− thymocytes. (C) Lck come&stay/signal duration model for CD8.4 OT-I Rag2−/− β2m−/− thymocytes. (D) Difference between CD8.4- and CD8WT-mediated TCR signaling (CD8.4/CD8WT ratio) in OT-I Rag2−/− β2m−/− thymocytes vs τ1/2 of a TCR ligand, predicted by the ‘Lck come&stay/signal duration’ model. Advantage of increased Lck coupling (CD8.4) is increasingly apparent at low τ1/2 (E) Comparison of TCR responses induced by pMHCI and pMHCII ligands in polyclonal preselection DP thymocytes predicted by the Lck come&stay/signal duration model. See also Figure S6, Table S3 and Extended Material and Methods.

Comment in

References

    1. Artyomov MN, Lis M, Devadas S, Davis MM, Chakraborty AK. CD4 and CD8 binding to MHC molecules primarily acts to enhance Lck delivery. Proc Natl Acad Sci U S A. 2010;107:16916–16921. - PMC - PubMed
    1. Bridgeman JS, Sewell AK, Miles JJ, Price DA, Cole DK. Structural and biophysical determinants of alphabeta T-cell antigen recognition. Immunology. 2012;135:9–18. - PMC - PubMed
    1. Daniels MA, Teixeiro E, Gill J, Hausmann B, Roubaty D, Holmberg K, Werlen G, Hollander GA, Gascoigne NR, Palmer E. Thymic selection threshold defined by compartmentalization of Ras/MAPK signalling. Nature. 2006;444:724–729. - PubMed
    1. Dushek O, Aleksic M, Wheeler RJ, Zhang H, Cordoba SP, Peng YC, Chen JL, Cerundolo V, Dong T, Coombs D, et al. Antigen potency and maximal efficacy reveal a mechanism of efficient T cell activation. Sci Signal. 2011;4:ra39. - PMC - PubMed
    1. Dustin ML, Bromley SK, Davis MM, Zhu C. Identification of self through two-dimensional chemistry and synapses. Annu Rev Cell Dev Biol. 2001;17:133–157. - PubMed

Publication types

MeSH terms

Substances