. 2015 Jan 1:104:241-52.
doi: 10.1016/j.neuroimage.2014.09.057. Epub 2014 Oct 2.

Quantification of microscopic diffusion anisotropy disentangles effects of orientation dispersion from microstructure: applications in healthy volunteers and in brain tumors

Affiliations

Quantification of microscopic diffusion anisotropy disentangles effects of orientation dispersion from microstructure: applications in healthy volunteers and in brain tumors

Filip Szczepankiewicz et al. Neuroimage. .

Abstract

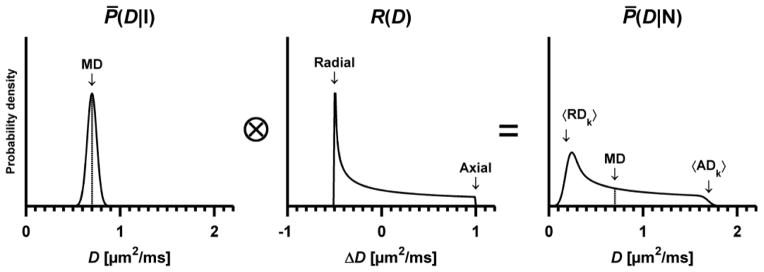
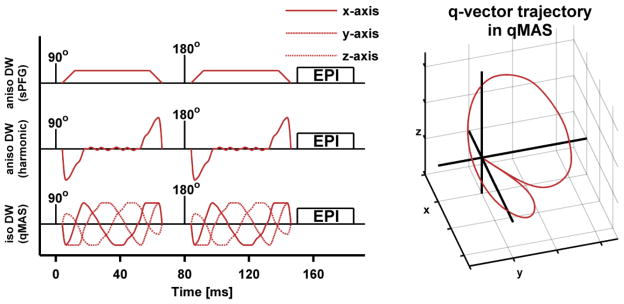
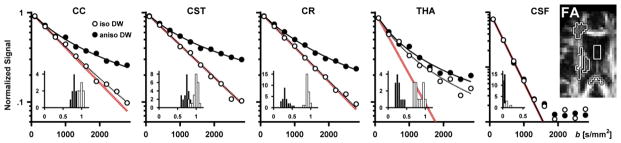
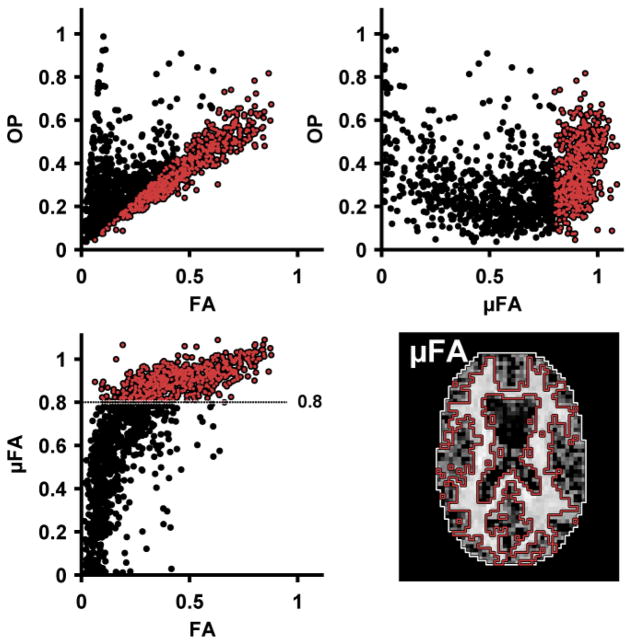
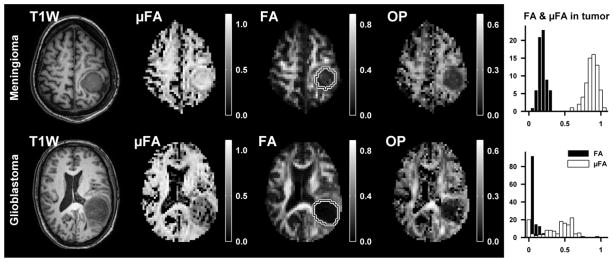
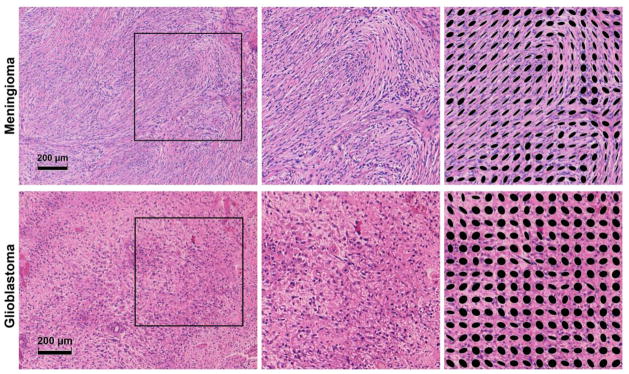
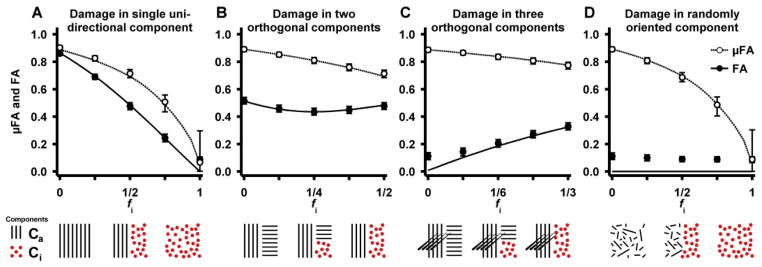
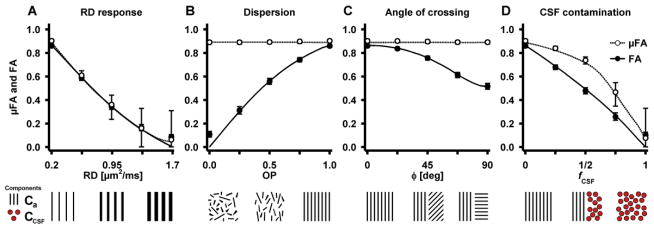
The anisotropy of water diffusion in brain tissue is affected by both disease and development. This change can be detected using diffusion MRI and is often quantified by the fractional anisotropy (FA) derived from diffusion tensor imaging (DTI). Although FA is sensitive to anisotropic cell structures, such as axons, it is also sensitive to their orientation dispersion. This is a major limitation to the use of FA as a biomarker for "tissue integrity", especially in regions of complex microarchitecture. In this work, we seek to circumvent this limitation by disentangling the effects of microscopic diffusion anisotropy from the orientation dispersion. The microscopic fractional anisotropy (μFA) and the order parameter (OP) were calculated from the contrast between signal prepared with directional and isotropic diffusion encoding, where the latter was achieved by magic angle spinning of the q-vector (qMAS). These parameters were quantified in healthy volunteers and in two patients; one patient with meningioma and one with glioblastoma. Finally, we used simulations to elucidate the relation between FA and μFA in various micro-architectures. Generally, μFA was high in the white matter and low in the gray matter. In the white matter, the largest differences between μFA and FA were found in crossing white matter and in interfaces between large white matter tracts, where μFA was high while FA was low. Both tumor types exhibited a low FA, in contrast to the μFA which was high in the meningioma and low in the glioblastoma, indicating that the meningioma contained disordered anisotropic structures, while the glioblastoma did not. This interpretation was confirmed by histological examination. We conclude that FA from DTI reflects both the amount of diffusion anisotropy and orientation dispersion. We suggest that the μFA and OP may complement FA by independently quantifying the microscopic anisotropy and the level of orientation coherence.

Keywords: Diffusion weighted imaging; Magic angle spinning of the q-vector; Microscopic anisotropy; Microscopic fractional anisotropy; Order parameter.


Conflict of interest statement

Conflict of interest statement

SL, DT and MN declare patent applications in Sweden (1250453-6 and 1250452-8), USA (61/642 594 and 61/642 589), and PCT (SE2013/050492 and SE2013/050493). Remaining authors declare no conflict of interest.

Figures

Figure 1
Figure 1
Schematic examples showing the effects of tensor averaging. The top row shows individual domain tensors (Dk) in the voxel volume, and the bottom row shows the corresponding voxel tensors (D) in tissue containing coherent, bending, random and isotropic domains. In this example, the domains in panel A, B and C have FAk = 0.8, while FAk = 0.0 in panel D. Effects of averaging across multiple orientations are seen in the shape of the voxel scale tensors. Note that FA cannot distinguish between randomly oriented anisotropic domains (C) and isotropic domains (D) since it is zero in both cases.
Figure 2
Figure 2
Schematic example of the distribution of diffusion coefficients when employing encoding that is isotropic (left, (D|I)) and anisotropic (right, (D|N)). The convolution visualizes how the variance of (D|I) is added to the variance of the anisotropy response function R(D), rendering the total variance in (D|N). This example depicts a system that contains axially symmetric and randomly oriented domains where MDk = 0.70 ± 0.05 μm2/ms, and the axial and radial domain diffusion is ADk = MDk + 1.0 μm2/ms and RDk = MDk − 0.5 μm2/ms, respectively (middle panel). Thus, the variance of the anisotropy response function is equal for all domains. The fact that the system contains anisotropic domains is reflected in the width of R(D), indicating that there is a difference between the eigenvalues of the domain tensors. The prolate symmetry of the domain tensors can be discerned from the shape of R(D), where the slow diffusion (RDk) is the most probable while the fast diffusion (ADk) is the least probable (Eriksson et al., 2013). Note that the area under each distribution equals unity, and that the y-axes have been adjusted to improve legibility.
Figure 3
Figure 3
Schematic comparison of sequences (left) and qMAS q-vector trajectory (right). The sequences show a spin-echo experiment where different types of diffusion encoding blocks (red lines) have been inserted on both sides of the 180°-pulse. The first two rows show examples of anisotropic diffusion encoding that use trapezoidal and harmonic gradient modulation, respectively. The bottom row shows the harmonic gradient modulation in isotropic qMAS. The q-vector trajectory in the qMAS experiment (right) follows the surface of a cone with an aperture of twice the magic angle resulting in the same encoding strength in all directions for each encoding block. Note that the speed of the qMAS q-vector along the trajectory varies as a function of its magnitude (low magnitude entails low speed), and that the magnitude of the qMAS encoding is zero during the 180°-pulse.
Figure 4
Figure 4
T1W, μFA, FA and OP maps from one healthy volunteer. The μFA is similar to the FA map in that it highlights the WM of the brain, but does so regardless of the local orientation dispersion. The μFA exhibits high values in areas where FA values are low due to crossing, bending and fanning fibers. Thus, the μFA map exhibits strong resemblance to the WM morphology in the T1W image, although the latter is not quantitative. The GM is visible in the μFA-map at a slightly lower intensity, indicating that the microscopic anisotropy is lower in GM as compared to WM. The OP displays similar contrast to the FA, in regions of WM.
Figure 5
Figure 5
Signal vs. b curves and parameter distributions in the corpus callosum (CC), corticospinal tract (CST), anterior crossing region (CR), thalamus (THA) and the cerebrospinal fluid in the lateral ventricles (CSF) in one healthy volunteer. The ROIs are shown in the FA map (right, black-white outline). The signal plots show the powder averaged signal from a single voxel in each region as measured with isotropic and anisotropic diffusion encoding (white and black circles), as well as the model fit (dashed and solid lines). The red lines are a visual reference showing monoexponential attenuation at the estimated mean diffusivity. The signal attenuation in all three WM regions is similar, where the isotropic encoding shows little deviation from monoexponential attenuation, while the anisotropic encoding exhibits a curvature in the signal attenuation, indicating that all regions contain microscopic anisotropy. In the THA, both the isotropic and anisotropic encoding shows a strong deviation from monoexponential attenuation, although the presence of microscopic anisotropy is made clear by the separation of the two curves. Note that the signal from the CSF was fitted only for signal values above 5% of the signal at b = 0 s/mm2, and that the y-axis in the CSF plot has a larger range than the other plots. The inserted histograms show the parameter distribution in each ROI where black and white bars represent FA and μFA, respectively. The histograms show that the μFA is similar in the three WM ROIs and that the largest difference between FA and μFA can be found in the CR and THA.
Figure 6
Figure 6
Voxel-wise parameter dependency between FA, μFA and OP in one healthy volunteer. The strongest correlation was found for the OP and FA (top left, see text for details). Separating the distribution at a threshold of μFA = 0.8 (red and black dots show μFA above and below 0.8, respectively) revealed a clear spatial dependency where high values of μFA are associated with the WM of the brain (voxels within red outline). The correlation between OP and FA in the WM indicates that FA is strongly dependent on the OP, i.e., the FA is strongly dependent on the coherence of WM fibers.
Figure 7
Figure 7
Parameter maps from the meningioma (top row) and glioblastoma (bottom row). The ROIs used for quantitative evaluation of diffusion parameters are shown in the FA maps (white-black outline). Both tumors exhibited low FA, while the μFA was high in the meningioma and low in the glioblastoma (histogram).
Figure 8
Figure 8
Microphotos of excised meningioma (top row) and glioblastoma (bottom row) tissue. The meningioma exhibited a dense fascicular pattern of growth with elongated tumor cells in a mostly monomorph structure. As seen in the upper left image, the fascicles in the meningioma could stretch for distances comparable to the voxel size (~1 mm). The glioblastoma exhibited a loose assemblage of rounded cells of variable size, along with patchy areas of necrosis. Blood vessels had thickened walls with endothelial cell proliferation and multiple small bleedings were included. The images on the right show magnified areas of the tumor tissue as well as structure tensors (black ellipses) that illustrate the local orientation of the tissue. The structure tensors in the meningioma showcase the presence of locally ordered structures, while few such structures are appear in the glioblastoma.
Figure 9
Figure 9
Response in FA and μFA in four geometries where one anisotropic component is replaced by an isotropic component to mimic tissue damage. The solid and broken lines show the noise free FA and μFA, respectively. The circular markers show the median parameter value when the SNR is 20, using the imaging protocol and parameterization detailed in the methods section. The error bars show the influence of noise as the inter quartile range. The geometries and processes are illustrated with graphics below the plots showing the anisotropic (black lines) and isotropic components (circles). Generally, the FA and μFA differ in all processes. In the single damaged WM component (A), the FA and μFA should be equal, but a positive bias in the μFA is induced due to the increasing presence of the isotropic component. In the double crossing (B), the FA can both increase and decrease due to the selective removal of anisotropic domains, whereas the μFA is strictly decreasing as a function of the reduction of anisotropy. In the triple crossing (C), the FA and μFA exhibit opposing effects, where FA increases and μFA decreases. The randomly oriented domains (D) illustrate that FA has no sensitivity to any changes in this case, while the μFA still reflects the presence of microscopic anisotropy.
Figure 10
Figure 10
Response in FA and μFA due to changes in microstructure geometry. The plot objects are described in the caption of Figure 9. The response to increasing radial diffusivity (A) is equivalent for FA and μFA, however, the quantification of μFA displays a higher uncertainty. Both the effects of dispersion (B) and angle of crossing (C) have no effect on the μFA, while the FA is strongly modulated. The effect of CSF contamination (D) shows a positive bias in μFA compared to FA, similar to that found in Figure 9A. Note that the values of FA and μFA in the simulation of CSF contamination are expected to be lower than the corresponding values in Figure 9A. The similarity arises from the model fitting, where the bias is positive in both cases, but more so in the case of CSF since the model violation is larger. The varying degree of bias works to counteract the underlying difference between the two environments. Generally, in environments with low levels of microscopic anisotropy, μFA exhibits a higher level of statistical uncertainty as compared to FA. Note that the noise prevents both FA and μFA from assuming values close to zero.

References

    1. Alexander AL, Hasan KM, Lazar M, Tsuruda JS, Parker DL. Analysis of partial volume effects in diffusion-tensor MRI. Magn Reson Med. 2001;45:770–780. - PubMed
    1. Alexander DC. A general framework for experiment design in diffusion MRI and its application in measuring direct tissue-microstructure features. Magn Reson Med. 2008;60:439–448. - PubMed
    1. Assaf Y, Pasternak O. Diffusion tensor imaging (DTI)-based white matter mapping in brain research: A review. J Mol Neurosci. 2008;34:51–61. - PubMed
    1. Basser PJ, Mattiello J, Le Bihan D. MR diffusion tensor spectroscopy and imaging. Biophys J. 1994;66:259–267. - PMC - PubMed
    1. Basser PJ, Pierpaoli C. Microstructural and physiological features of tissues elucidated by quantitative-diffusion-tensor MRI. J Magn Reson. 1996:209–2019. - PubMed

Publication types