. 2015 Jan:263:102-12.
doi: 10.1016/j.expneurol.2014.09.020. Epub 2014 Oct 5.

Biomarkers for disease progression and AAV therapeutic efficacy in feline Sandhoff disease

Affiliations

Biomarkers for disease progression and AAV therapeutic efficacy in feline Sandhoff disease

Allison M Bradbury et al. Exp Neurol. 2015 Jan.

Abstract

The GM2 gangliosidoses, Tay-Sachs disease (TSD) and Sandhoff disease (SD), are progressive neurodegenerative disorders that are caused by a mutation in the enzyme β-N-acetylhexosaminidase (Hex). Due to the recent emergence of novel experimental treatments, biomarker development has become particularly relevant in GM2 gangliosidosis as an objective means to measure therapeutic efficacy. Here we describe blood, cerebrospinal fluid (CSF), magnetic resonance imaging (MRI), and electrodiagnostic methods for evaluating disease progression in the feline SD model and application of these approaches to assess AAV-mediated gene therapy. SD cats were treated by intracranial injections of the thalami combined with either the deep cerebellar nuclei or a single lateral ventricle using AAVrh8 vectors encoding feline Hex. Significantly altered in untreated SD cats, blood and CSF based biomarkers were largely normalized after AAV gene therapy. Also reduced after treatment were expansion of the lysosomal compartment in peripheral blood mononuclear cells and elevated activity of secondary lysosomal enzymes. MRI changes characteristic of the gangliosidoses were documented in SD cats and normalized after AAV gene therapy. The minimally invasive biomarkers reported herein should be useful to assess disease progression of untreated SD patients and those in future clinical trials.

Keywords: Biomarkers; GM2 ganglioside; Gene therapy; Hexosaminidase; Lysosomal storage disorder; Neurodegenerative disease.


Conflict of interest statement

Conflict of Interest: On behalf of all authors, the corresponding author states that there is no conflict of interest.

Figures

Fig. 1
Fig. 1
CSF levels of a) Aspartate aminotransferase (AST) and b) Lactate dehydrogenase (LDH) in CSF of normal, Sandhoff (SD), and SD cats 16 weeks after AAV gene therapy by Thal+DCN and Thal+ICV injection routes. Levels of AST and LDH significantly increase over time in the SD cat. AST and LDH are restored to normal levels after AAV gene therapy by Thal+DCN and Thal+ICV injection routes. Normal cats: n=14; SD cats: 0-5 weeks, n=9; 8-12 weeks, n=10; 16-23 weeks, n=9; Thal+DCN: 16-23 weeks, n=6; Thal+ICV: 16-23 weeks, n=6. (*denotes p<0.05 from normal, **denotes p<0.01 from normal, † denotes p<0.05 from SD, ǂ denotes p<0.01 from SD; error bars represent standard deviation)
Fig. 2
Fig. 2
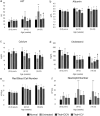
Blood chemistry findings in normal, Sandhoff (SD), and SD cats 16 weeks after AAV gene therapy by Thal+DCN and Thal+ICV injection routes. a) Aspartate aminotransferase (AST) levels increase over time in SD cats when compared to normal age-matched controls and are normalized after AAV gene therapy by 16-23 weeks in both Thal+DCN and Thal+ICV cohorts. b) Albumin levels decrease with time in the SD cats and are normalized by 16-23 weeks of age in AAV-treated cats. c) Calcium levels also decrease over time, with normalization in the Thal+DCN group by 16-23 weeks of age. d) Blood cholesterol levels decrease over time and are only partially normalized in the Thal+ICV cohort at 16-23 weeks. e) Red blood cell number is decreased in SD cats. f) Neutrophils in SD cats were significantly increased, as compared to normal controls, at all time points. Treatment with AAV by Thal+ICV, but not Thal+DCN, returned the neutrophil count to normal levels. Normal cats: 0-5 weeks, n=10; 8-12 weeks, n=9; 16-23 weeks, n=8; SD cats: 0-5 weeks, n=9, 8-12 weeks, n=11, 16-23 weeks, n=17 (except BUN n=14); Thal+DCN: 0-5 weeks, n=13; 8-12 weeks, n=9; 16-23 weeks, n=10; Thal+ICV: 0-5 weeks, n=6; 8-12 weeks, n=6; 16-23 weeks, n=8 (except AST n=7). (*denotes p<0.05 from normal, **denotes p<0.01 from normal, † denotes p<0.05 from SD, ǂ denotes p<0.01 from SD; error bars represent standard deviation)
Fig. 3
Fig. 3
LysoTracker quantification in peripheral blood mononuclear cells (PMBCs). a) Percent of positive cells increased with age in SD cats and was significantly higher than normal control cats by 12 weeks of age (8 weeks, n=5; 12 weeks, n=6; 16 weeks, n=6; endpoint, n=5). b) Thal+ICV gene therapy decreased the percentage of LysoTracker positive cells (n=3, 22.3 ± 1.0 weeks), yet values remained significantly higher (p < 0.05) than normal cats (n=5) at that time point. Results from the Thal+ICV cohort were not significantly different from SD cats (p > 0.05). Analysis was not conducted for the Thal+DCN treatment group due to low animal numbers (n=2). c) Cytospins from sorted LysoTracker positive cells consisted primarily of neutrophils (scale bar = 50 μM; inset scale bar =10μM). (*denotes p<0.05 from normal, **denotes p<0.01 from normal, † denotes p<0.05 from SD, ǂ denotes p<0.01 from SD; error bars represent standard deviation)
Fig. 4
Fig. 4
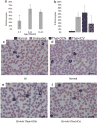
Echinocytes (spiculated red blood cells) in SD cats. a) In SD cats, echinocyte formation increases by 8-12 weeks of age (n=4) and b) remains elevated after AAV gene therapy (normal, n=4; SD, n=4; Thal+DCN, n=2; Thal+ICV, n=2). Representative photomicrographs show increased echinocytosis in the c) SD cat as compared to d) normal. Echinocyte levels appear elevated in the e) Thal+DCN and intermediate in the f) Thal+ICV groups. There was large variability in echinocytosis for the Thal+ICV cohort (range 2.1% - 54.0%). Nucleated cells in the field of view (neutrophils, lymphocytes and monocytes) are part of a typical feline blood smear. (*denotes p<0.05 from normal; error bars represent standard deviation; black bar=10μM)
Fig. 5
Fig. 5
Brain and peripheral tissue enzyme restoration. a) Following Thal+ICV injection, levels of Hex A in the brain of cats reach >50-fold normal at the injection site and correspond directly to levels of Hex A achieved in the liver. Hex A in the brain and liver also directly correlate with normalization of Bgal and Mann in PBMCs. (Hex A was not elevated above untreated SD levels in PBMCs). Normal (n=4) and SD (n=5) values are provided for reference. Values are reported as specific activity expressed as nmol 4-MU cleaved/mg protein/hour. H&E stains of the liver show notable vacuolation of hepatocytes in b) SD cat at humane endpoint compared to c) a normal age-matched control cat. d) Sixteen weeks after intracranial AAV therapy, cat 7-972 had normal levels of Hex activity in the liver and architecture was largely normalized, with some hepatocytes containing multiple, small intracytoplasmic vacuoles. e) In comparison, vacuolated hepatocytes were more prevalent in cat 7-957, which had reduced Hex activity (black bar=10μM)
Fig. 6
Fig. 6
MRI changes in brain. Imaging was performed in untreated SD (n=6; humane endpoint), normal (n=3; age-matched), and SD cats 16 weeks after AAV gene therapy by Thal+DCN (n=3) and Thal+ICV (n=1) injection routes. White matter (WM) becomes isointense (loss of defined boundaries) or hyperintense (lighter than) to gray matter (GM) in the b) untreated SD cat compared to a) normal. Also, cortical atrophy in the untreated SD cat is apparent from widened sulci and enlarged ventricles. AAV gene therapy by c) Thal+DCN and d) Thal+ICV restored GM and WM intensities in most areas. Aberrant hyperintensities (arrow) are noted in the dorsal thalamus in both Thal+DCN and Thal+ICV groups at approximately the level of the injection site. MRI changes are quantified in the e) frontal cortex and striatum, f) occipital cortex and midbrain, g) thalamus, and h) cerebellum and brainstem. Significant changes in signal intensity were detectable in many brain regions of SD cats. Most importantly, many areas altered in SD cats were normalized in the Thal+DCN group. Interestingly, the deep cerebellar nuclei injection site had a signal intensity intermediate to untreated SD and normal. (*denotes p<0.05 from normal, **denotes p<0.01 from normal, † denotes p<0.05 from SD, ‡ denotes p<0.01 from SD; error bars represent standard deviation). Statistical analysis was not performed for the Thal+ICV cohort, since only one animal was imaged.
Fig. 7
Fig. 7
Brainstem auditory evoked responses in SD cats. a) In untreated SD cats, significant increases in latencies were noted in waves II and V at both 8-12 and 16-23 weeks of age. Wave III had increased latency at 16-23 weeks. b) Increased interwave latencies were present between waves III-V and I-V at 8-12 weeks, and between all waves at 16-23 weeks. Normal cats n=4, SD cats n=4 for all time points (*denotes p<0.05 from normal, **denotes p<0.01 from normal; error bars represent standard deviation).

References

    1. Ohshima T, Murray GJ, Swaim WD, Longenecker G, Quirk JM, et al. alpha-Galactosidase A deficient mice: a model of Fabry disease. Proc Natl Acad Sci U S A. 1997;94:2540–2544. - PMC - PubMed
    1. Phaneuf D, Wakamatsu N, Huang JQ, Borowski A, Peterson AC, et al. Dramatically different phenotypes in mouse models of human Tay-Sachs and Sandhoff diseases. Hum Mol Genet. 1996;5:1–14. - PubMed
    1. Casal M, Haskins M. Large animal models and gene therapy. Eur J Hum Genet. 2006;14:266–272. - PubMed
    1. Aye MM, Izumo S, Inada S, Isashiki Y, Yamanaka H, et al. Histopathological and ultrastructural features of feline hereditary cerebellar cortical atrophy: a novel animal model of human spinocerebellar degeneration. Acta Neuropathol. 1998;96:379–387. - PubMed
    1. Podell M, March PA, Buck WR, Mathes LE. The feline model of neuroAIDS: understanding the progression towards AIDS dementia. J Psychopharmacol. 2000;14:205–213. - PubMed

Publication types