. 2014 Dec;18(12):2404-16.
doi: 10.1111/jcmm.12420. Epub 2014 Oct 6.

MiRNA-30a inhibits AECs-II apoptosis by blocking mitochondrial fission dependent on Drp-1

Affiliations

MiRNA-30a inhibits AECs-II apoptosis by blocking mitochondrial fission dependent on Drp-1

Cuiping Mao et al. J Cell Mol Med. 2014 Dec.

Abstract

Apoptosis of type II alveolar epithelial cells (AECs-II) is a key determinant of initiation and progression of lung fibrosis. However, the mechanism of miR-30a participation in the regulation of AECs-II apoptosis is ambiguous. In this study, we investigated whether miR-30a could block AECs-II apoptosis by repressing mitochondrial fission dependent on dynamin-related protein-1 (Drp-1). The levels of miR-30a in vivo and in vitro were determined through quantitative real-time PCR (qRT-PCR). The inhibition of miR-30a in AECs-II apoptosis, mitochondrial fission and its dependence on Drp-1, and Drp-1 expression and translocation were detected using miR-30a mimic, inhibitor-transfection method (gain- and loss-of-function), or Drp-1 siRNA technology. Results showed that miR-30a decreased in lung fibrosis. Gain- and loss-of-function studies revealed that the up-regulation of miR-30a could decrease AECs-II apoptosis, inhibit mitochondrial fission, and reduce Drp-1 expression and translocation. MiR-30a mimic/inhibitor and Drp-1 siRNA co-transfection showed that miR-30a could inhibit the mitochondrial fission dependent on Drp-1. This study demonstrated that miR-30a inhibited AECs-II apoptosis by repressing the mitochondrial fission dependent on Drp-1, and could function as a novel therapeutic target for lung fibrosis.

Keywords: AECs-II; Drp-1; apoptosis; lung fibrosis; miRNA-30a; mitochondrial fission.


Figures

Fig. 1
Fig. 1
MiR-30a decreased in vivo and in vitro models of lung fibrosis. (A) Haematoxylin and eosin staining showed that the severity of the pathology of lung fibrosis increased in BLM-induced group, magnification ×400. (B) Masson's trichrome staining indicated that collagen increased in BLM-induced group, magnification ×400. (C) The qRT-PCR analysis demonstrated that miR-30a decreased in BLM-induced lung fibrosis. (D) Inhibitory effect of H2O2 was detected using an SRB assay. (E) The qRT-PCR analysis showed that miR-30a decreased in H2O2-induced group. A549 was treated with 120 μM H2O2, and harvested at 3, 6, 12, and 24 hrs. Each bar represents the mean ± SD, n = 6, *P < 0.05; #P < 0.01.
Fig. 2
Fig. 2
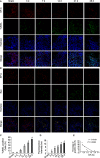
AECs-II apoptosis increased in vivo models of lung fibrosis. (A) Apoptotic cell nucleus was stained using TUNEL labelled with FITC (green). The SP-C and nucleus were stained with SP-C antibody (red) and Hochest 33258 (blue), respectively. (B) SP-C and Bax were stained with SP-C antibody (red) and Bax antibody (green), respectively, whereas the nucleus was stained with Hoechst 33258 (blue). (C) TUNEL-positive cells increased in vivo, and the TUNEL+ SPC+ cells and SPC+ cells in each whole image were counted; the bar graph represents the rate of TUNEL+SPC+ cells in SPC+ cells from three independent experiments. (D) The expression of Bax increased in vivo. The mean fluorescence intensity of Bax in each whole image was automatically quantified using Image-Pro Plus software and expressed in fluorescence units (FU); the bar graph represents the average value from three independent experiments. (E) MiR-30a was inversely correlated with apoptotic cells, r = −0.8129. Each bar represents the mean ± SD n = 6, *P < 0.05; #P < 0.01.
Fig. 3
Fig. 3
AECs-II apoptosis increased in the lung fibrosis of the patient. (A) Apoptosis was detected through TUNEL. Apoptotic cell nucleus and SP-C were stained with TUNEL labelled with FITC (green) and SP-C antibody (red). (B) SP-C and Bax expression was determined using a laser scanning confocal microscope. SP-C and Bax were stained, respectively, with SP-C antibody (green) and Bax antibody (red), nuclei was stained by hochest 33258 (blue).
Fig. 4
Fig. 4
AECs-II apoptosis increased in vitro models of lung fibrosis. (A) Apoptosis was detected through flow cytometry. U1 represents necrotic cells; U2 denotes middle-late apoptotic cells; U3 indicates normal cells; U4 denotes early apoptotic cells. U2+U4 represents apoptotic cells. A549 was treated with 120 μM H2O2 and obtained at 3, 6, 12, and 24 hrs. With the extension of H2O2-induced time, apoptotic cells increased. (B) Apoptotic rate statistics of each group. (C) MiR-30a was inversely correlated with apoptotic cells. r = −0.8787. Each bar represents the mean ± SD, n = 6, *P < 0.05; #P < 0.01.
Fig. 5
Fig. 5
MiR-30a inhibited AECs-II apoptosis. (A) A549 was transfected with miR-30a mimic-negative control or mimic at 50 nM for 48 hrs, and then treated with H2O2 for 12 hrs; A549 was transfected with miR-30a inhibitor-negative control or inhibitor at 100 nM for 48 hrs, and then co-treated with H2O2 for 12 hrs. (B) Apoptotic rate of each group. Each bar represents the mean ± SD, n = 6, *P < 0.05; #P < 0.01.
Fig. 6
Fig. 6
MiR-30a inhibited mitochondrial fission in vivo and in vitro models of lung fibrosis. (A) Mitochondrial fission was detected through TEM. Mitochondria became smaller and increased in BLM-induced group compared with the sham group. (a) Sham group, (b) BLM-induced group. (B) Mitochondrial morphology was observed using a laser scanning confocal microscope. (a) Control group, (b) 12 hrs H2O2-induced group, (c and d) A549 were transfected with miR-30 mimic-negative control or mimic at 50 nM for 48 hrs, respectively, and then co-treated with H2O2 for 12 hrs. (e and f) A549 was transfected with miR-30 inhibitor-negative control or inhibitor at 100 nM for 48 hrs and then co-treated with H2O2 for 12 hrs. (C) Percentage of mitochondrial fission cells. (D) miR-30a was inversely correlated with mitochondrial fission cells. r = −0.8802. Each bar represents the mean ± SD, n = 6, *P < 0.05; #P < 0.01.
Fig. 7
Fig. 7
MiR-30a inhibited Drp-1 expression. (A) MiR-30a was inversely correlated with p53. r = −0.8787. (B) Immunofluorescence showed that Drp-1 expression increased in vivo. Drp-1 expression was determined using a laser scanning confocal microscope. SP-C (red) and Drp-1 (green) were stained with IgG labelled with Cy3 and IgG labelled with FITC, respectively. Nuclei (blue) were counter-stained with Hoechst 33258. (C) The qRT-PCR analysis demonstrated that Drp-1 expression increased in vivo. (D) MiR-30a was inversely correlated with Drp-1 expression. r = −0.9190. (E) p53 was positive correlated with Drp-1. r = 0.9595. (F) SP-C and Drp-1 expression were determined using a laser scanning confocal microscope in the patient of lung fibrosis. SP-C, Drp-1 and nucleus was stained as A. (G) Drp-1 expression increased in the lung fibrosis of the patient. (H) Drp-1 expression was detected using qRT-PCR in vitro. Each bar represents the mean ± SD, n = 6, *P < 0.05; #P < 0.01.
Fig. 8
Fig. 8
MiR-30a inhibited Drp-1 translocation. (A) Drp-1 translocation was detected using western blot in vivo. (a) Drp-1 and GAPDH expressions in the cytoplasm. (b) Drp-1 and COX IV expressions in the mitochondria. (c) The rate of Mito-Drp-1 in cyto-Drp-1 increased. (B) Drp-1 translocation was determined using western blot in vitro. (a) Drp-1 and GAPDH expressions in the cytoplasm. (b) Drp-1 and COX IV expressions in the mitochondria. (c) The rate of Mito-Drp-1 in cyto-Drp-1 decreased in miR-30a mimic-transfection group. The rate of Mito-Drp-1 in cyto-Drp-1 increased in H2O2-induced group and miR-30a inhibitor-transfection group. Each bar represents the mean ± SD, n = 6, *P < 0.05; #P < 0.01.
Fig. 9
Fig. 9
MiR-30a inhibited mitochondrial fission dependent on Drp-1 in vitro. (A) Mitochondrial morphology was determined with a laser scanning confocal microscope. (a) Control group. (b) 12 hrs H2O2-induced group. (c and d) A549 was transfected with Drp-1 siRNA negative control and Drp-1 siRNA, respectively, at 50 nM for 48 hrs, and then treated with H2O2 for 12 hrs. (e) A549 was cotransfected with Drp-1 siRNA and miR-30a mimic at 50 nM for 48 hrs, and then treated with H2O2 for 12 hrs. (f) A549 was cotransfected with Drp-1 siRNA and miR-30a inhibitor at 100 nM for 48 hrs, and then treated with H2O2 for 12 hrs. (B) The percentage of mitochondrial fission cells. (C) Apoptosis was detected using flow cytometry under different conditions. (D) Apoptotic rate of each group. Each bar represents the mean ± SD, n = 6, *P < 0.05; #P < 0.01.

References

    1. Fernandez IE, Eickelberg O. New cellular and molecular mechanisms of lung injury and fibrosis in idiopathic pulmonary fibrosis. Lancet. 2012;380:680–8. - PubMed
    1. Downey GP. Resolving the scar of pulmonary fibrosis. N Engl J Med. 2011;365:1140–1. - PubMed
    1. Blackwell TS, Tager AM, Borok Z, et al. Future directions in idiopathic pulmonary fibrosis research. An NHLBI workshop report. Am J Respir Crit Care Med. 2014;189:214–22. - PMC - PubMed
    1. Wolters PJ, Collard HR, Jones KD. Pathogenesis of idiopathic pulmonary fibrosis. Annu Rev Pathol. 2014;9:157–79. - PMC - PubMed
    1. Pandit KV, Milosevic J, Kaminski N. MicroRNAs in idiopathic pulmonary fibrosis. Transl Res. 2011;157:191–9. - PubMed

Publication types

MeSH terms

LinkOut - more resources