. 2014 Oct 9;9(1):366-377.
doi: 10.1016/j.celrep.2014.08.057. Epub 2014 Oct 2.

Central ceramide-induced hypothalamic lipotoxicity and ER stress regulate energy balance

Affiliations

Central ceramide-induced hypothalamic lipotoxicity and ER stress regulate energy balance

Cristina Contreras et al. Cell Rep. .

Abstract

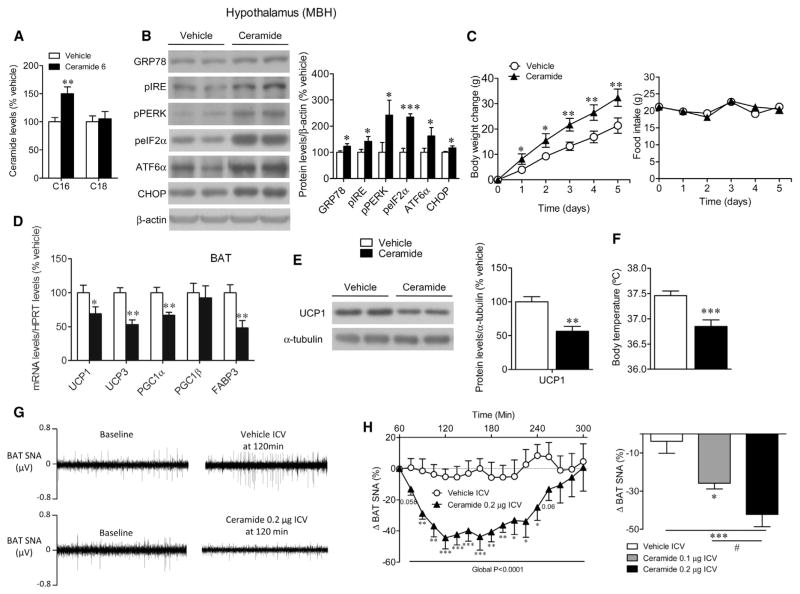
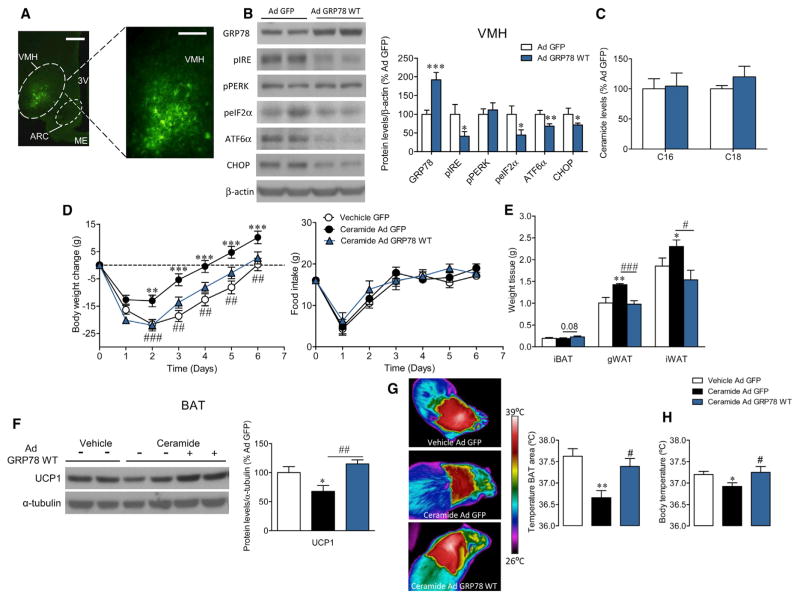
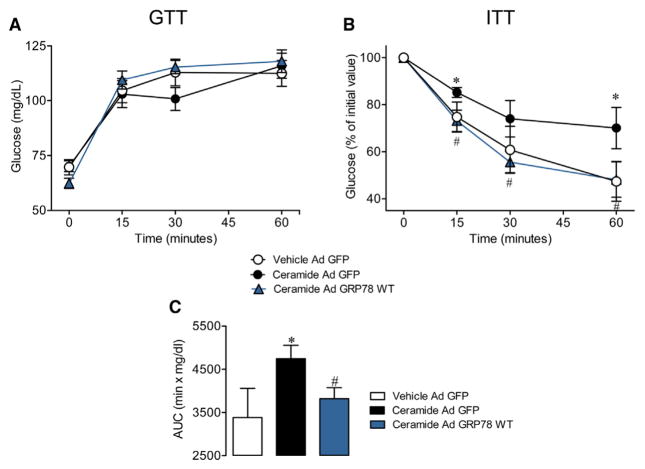
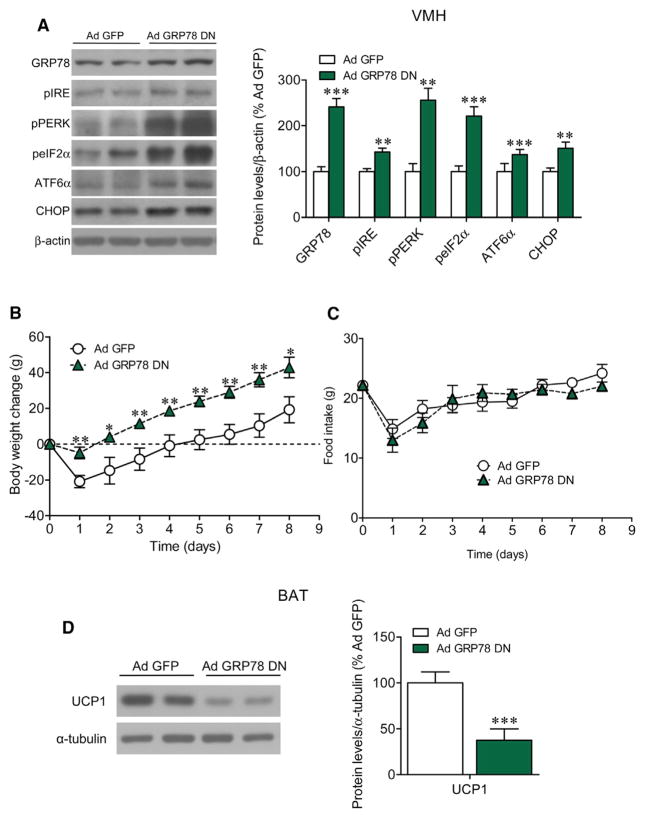
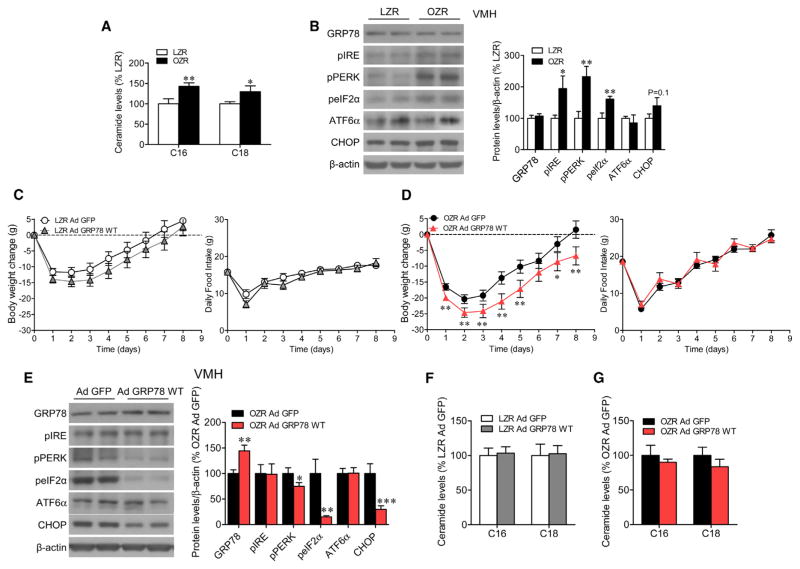
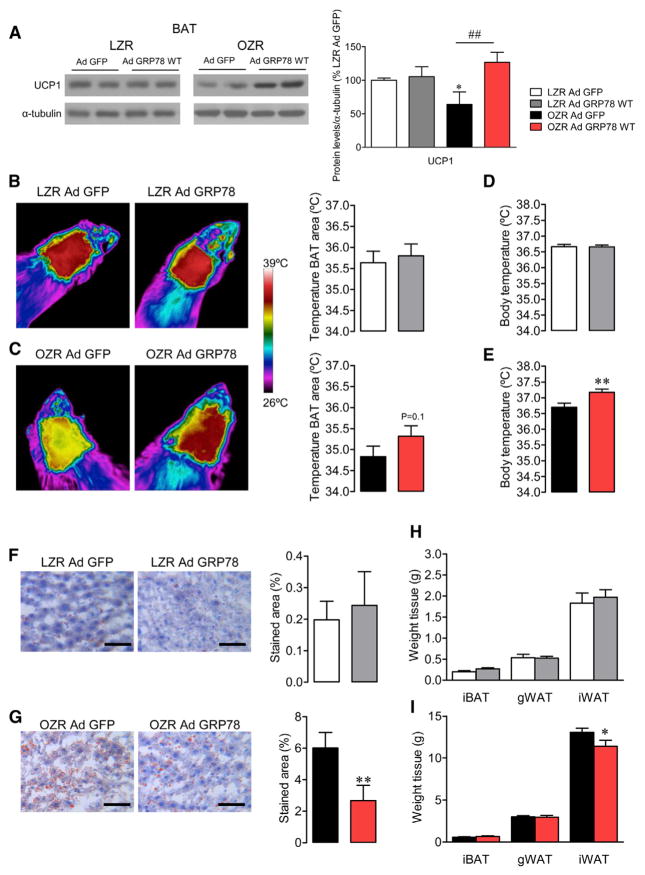
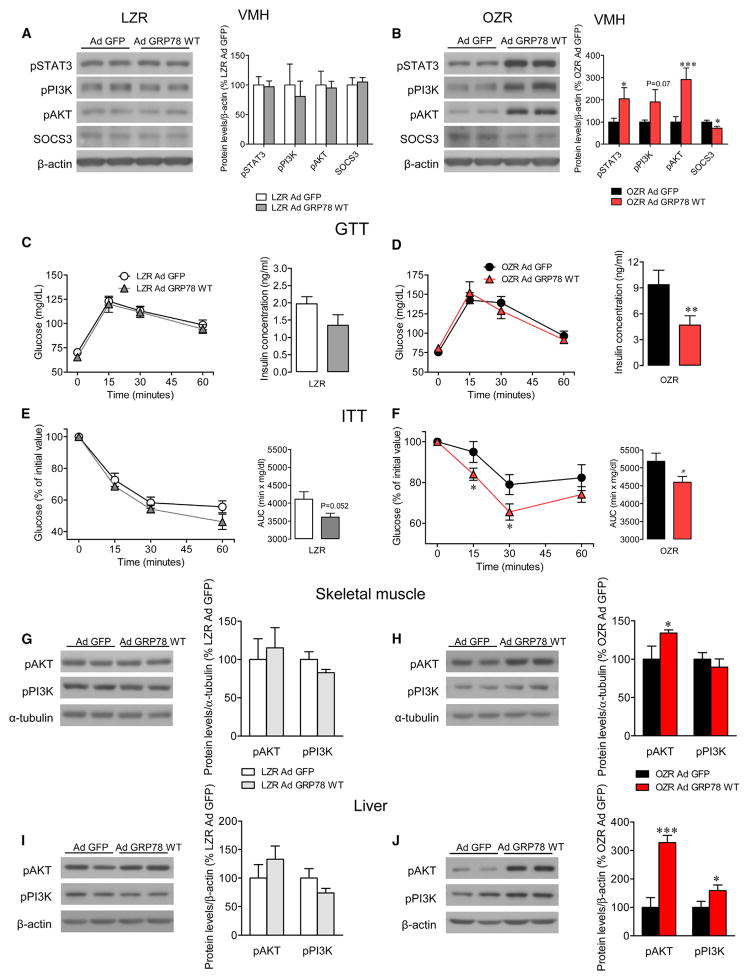
Hypothalamic endoplasmic reticulum (ER) stress is a key mechanism leading to obesity. Here, we demonstrate that ceramides induce lipotoxicity and hypothalamic ER stress, leading to sympathetic inhibition, reduced brown adipose tissue (BAT) thermogenesis, and weight gain. Genetic overexpression of the chaperone GRP78/BiP (glucose-regulated protein 78 kDa/binding immunoglobulin protein) in the ventromedial nucleus of the hypothalamus (VMH) abolishes ceramide action by reducing hypothalamic ER stress and increasing BAT thermogenesis, which leads to weight loss and improved glucose homeostasis. The pathophysiological relevance of this mechanism is demonstrated in obese Zucker rats, which show increased hypothalamic ceramide levels and ER stress. Overexpression of GRP78 in the VMH of these animals reduced body weight by increasing BAT thermogenesis as well as decreasing leptin and insulin resistance and hepatic steatosis. Overall, these data identify a triangulated signaling network involving central ceramides, hypothalamic lipotoxicity/ER stress, and BAT thermogenesis as a pathophysiological mechanism of obesity.


Figures

Figure 1
Figure 1. Effect of Central Administration of Ceramide on Energy Balance
Ceramide levels in the mediobasal hypothalamus (MBH) (A), representative western blot autoradiographic images (B, left; spliced bands loaded in the same gel) and hypothalamic protein levels of UPR (B, right), body weight change (C, left) and daily food intake (C, right), mRNA expression in the BAT (D), representative western blot autoradiographic images (E, left; spliced bands loaded in the same gel) and protein levels of BAT UCP1 (E, right), rectal temperature (F), BAT sympathetic nervous activity (SNA) tracings (G), and change in BAT SNA of rats centrally treated with vehicle or ceramide 6 (H). Error bars represent SEM; n = 5–7 (SNA recordings) or n = 7–26 animals per experimental group. *p < 0.05, **p < 0.01, and ***p < 0.001 versus vehicle, #p < 0.05 ceramide 0.2 μg ICV versus ceramide 0.1 μg ICV.
Figure 2
Figure 2. Effect of GRP78 Overexpression in the VMH on Central Ceramide Actions and Energy Balance
(A–C) Representative immunofluorescence (A, left: 4×, scale bar, 300 μm; A, right: 20×, scale bar 100 μm) with anti-GFP showing GFP expression in the VMH, representative western blot autoradiographic images (B, left; spliced bands loaded in the same gel) and hypothalamic protein levels of UPR (B, right; see Figure S1A for analysis of inflammatory markers in the hypothalamus), and ceramide levels (C) in the mediobasal hypothalamus of rats treated with GFP or GRP78 WT adenoviruses into the VMH. (D–H) Body weight change (D, left) and daily food intake (D, right); weight of iBAT, gWAT, and iWAT pads (E); representative western blot autoradiographic images (F, left; spliced bands loaded in the same gel) and protein levels of BAT UCP1 (F, right); representative infrared thermal images (G, left) and temperature of the BAT area (G, right); and rectal temperature (H) of rats centrally treated with vehicle or ceramide and stereotaxically treated with GFP or GRP78 WT adenoviruses into the VMH. In order to simplify (D)–(H), the vehicle Ad GRP78 WT group has been omitted; in any case, it is important to note that no differences were found in that group when compared to vehicle Ad GFP (see Figures S1B and S1C). Error bars represent SEM; n = 6 (fat pads and temperature) or 7–47 animals per experimental group. 3V, third ventricle; ME, median eminence. *p < 0.05, ** p < 0.01, and ***p < 0.001 versus Ad GFP or vehicle Ad GFP; #p < 0.05, ## p < 0.01, and ###p < 0.001 ceramide Ad GFP versus ceramide Ad GRP78 WT. See Figures S1D–S1H for analysis of GRP78 WT adenoviruses in the arcuate nucleus of the hypothalamus.
Figure 3
Figure 3. Effect of GRP78 Overexpression in the VMH on Central Ceramide Actions on Glucose Homeostasis and Insulin Sensitivity
Glucose tolerance test (GTT) (A), insulin tolerance test (ITT) (B), and area under the curve (AUC) (C) from ITT of rats centrally treated with vehicle or ceramide and stereotaxically treated with GFP or GRP78 WT adenoviruses into the VMH. Error bars represent SEM; n = 7–9 animals per experimental group. *p < 0.05 versus vehicle Ad GFP; # p < 0.05 ceramide Ad GFP versus ceramide Ad GRP78 WT.
Figure 4
Figure 4. Effect of GRP78 Inhibition in the VMH on Energy Balance
Representative western blot autoradiographic images (A, left; spliced bands loaded in the same gel) and hypothalamic protein levels of UPR (A, right), body weight change (B), daily food intake (C), and representative western blot autoradiographic images (D, left; spliced bands loaded in the same gel) and protein levels of BAT UCP1 (D, right) of rats treated with GFP or GRP78 DN adenoviruses into the VMH. Error bars represent SEM; n = 7–9 animals per experimental group. *p < 0.05, ** p < 0.01, and ***p < 0.001 versus Ad GFP. See Figure S2 for analysis of GRP78 DN adenoviruses in the arcuate nucleus of the hypothalamus.
Figure 5
Figure 5. Effect of GRP78 Overexpression in the VMH of Obese Zucker Rats on Energy Balance
(A and B) Ceramide levels in the mediobasal hypothalamus (A) and representative western blot autoradiographic images (B, left; spliced bands loaded in the same gel) and hypothalamic protein levels of UPR (B, right) in LZR and OZR. (C–G) Body weight change (C and D, left) and daily food intake (C and D, right) from LZR and OZR, respectively; representative western blot autoradiographic images (E, left; spliced bands loaded in the same gel) and VMH protein levels of UPR from OZR (E, right); and ceramide levels in the mediobasal hypothalamus of LZR (F) and OZR (G) stereotaxically treated with GFP or GRP78 WT adenoviruses into the VMH. Error bars represent SEM; n = 7–33 animals per experimental group. *p < 0.05, **p < 0.01, ***p < 0.001 versus LZR or OZR Ad GFP.
Figure 6
Figure 6. Effect of GRP78 Overexpression in the VMH of Obese Zucker Rats on BAT Thermogenesis and Liver Steatosis
Representative western blot autoradiographic images (A, left; spliced bands loaded in the same gel) and protein levels of BAT UCP1 (A, right); representative infrared thermal images (B and C, left) and temperature of the BAT area (B and C, right); rectal temperature (D and E); representative oil red O-stained liver sections (F and G, left; scale bar, 50 μm) and their quantification (F and G, right panel); and weight of iBAT, gWAT, and iWAT pads from LZR (H) and OZR (I) stereotaxically treated with GFP or GRP78 WT adenoviruses into the VMH. Error bars represent SEM; n = 7–9 animals per experimental group. *p < 0.05 and **p < 0.01 versus LZR or OZR Ad GFP; ##p < 0.01 OZR Ad GFP versus OZR Ad GRP78 WT.
Figure 7
Figure 7. Effect of GRP78 Overexpression in the VMH of Obese Zucker Rats on Leptin Signaling, Glucose Homeostasis, and Insulin Sensitivity
Representative western blot autoradiographic images (A and B, left; spliced bands loaded in the same gel) and hypothalamic protein levels of leptin signaling pathway in the VMH (A and B, right) from LZR and OZR; GTT (C and D, left) and serum insulin concentration after 30 min of glucose administration (C and D, right); ITT (E and F, left) and area under the curve (AUC) from ITT (E and F, right); and representative western blot autoradiographic images (G–J, left; spliced bands loaded in the same gel) and protein levels of insulin signaling pathway in skeletal muscle and liver (G–J, right) of LZR and OZR stereotaxically treated with GFP or GRP78 WT adenoviruses into the VMH. Error bars represent SEM; n = 6 (pAKT and pPI3K in LZR) or n = 7–10 animals per experimental group. *p < 0.05, **p < 0.01, and ***p < 0.001 versus LZR Ad GFP or OZR Ad GFP.

Similar articles

Cited by

References

    1. Beiroa D, Romero-Picó A, Langa C, Bernabeu C, López M, López-Novoa JM, Nogueiras R, Diéguez C. Heterozygous deficiency of endoglin decreases insulin and hepatic triglyceride levels during high fat diet. PLoS ONE. 2013;8:e54591. - PMC - PubMed
    1. Beiroa D, Imbernon M, Gallego R, Senra A, Herranz D, Villaroya F, Serrano M, Fernø J, Salvador J, Escalada J, et al. GLP-1 Agonism Stimulates Brown Adipose Tissue Thermogenesis and Browning Through Hypothalamic AMPK. Diabetes. 2014 http://dx.doi.org/10.2337/db14-0302. - DOI - PubMed
    1. Bikman BT, Summers SA. Ceramides as modulators of cellular and whole-body metabolism. J Clin Invest. 2011;121:4222–4230. - PMC - PubMed
    1. Borg ML, Omran SF, Weir J, Meikle PJ, Watt MJ. Consumption of a high-fat diet, but not regular endurance exercise training, regulates hypothalamic lipid accumulation in mice. J Physiol. 2012;590:4377–4389. - PMC - PubMed
    1. Cannon B, Nedergaard J. Brown adipose tissue: function and physiological significance. Physiol Rev. 2004;84:277–359. - PubMed

Publication types