. 2014 Sep 19:5:488.
doi: 10.3389/fmicb.2014.00488. eCollection 2014.

Effect of mono- and dichromatic light quality on growth rates and photosynthetic performance of Synechococcus sp. PCC 7002

Affiliations

Effect of mono- and dichromatic light quality on growth rates and photosynthetic performance of Synechococcus sp. PCC 7002

Hans C Bernstein et al. Front Microbiol. .

Abstract

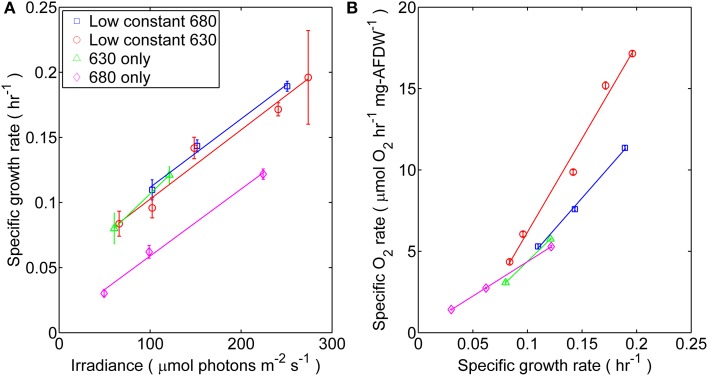
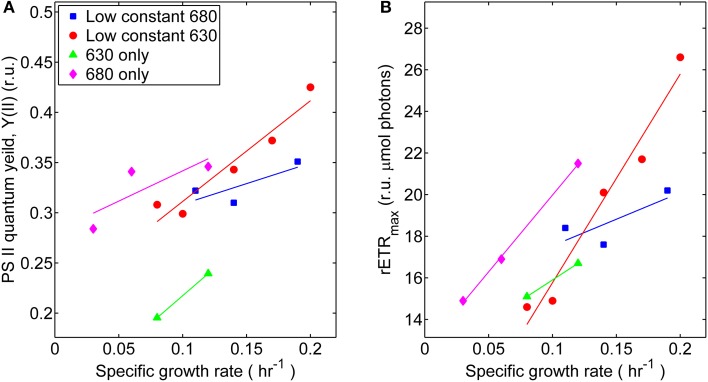
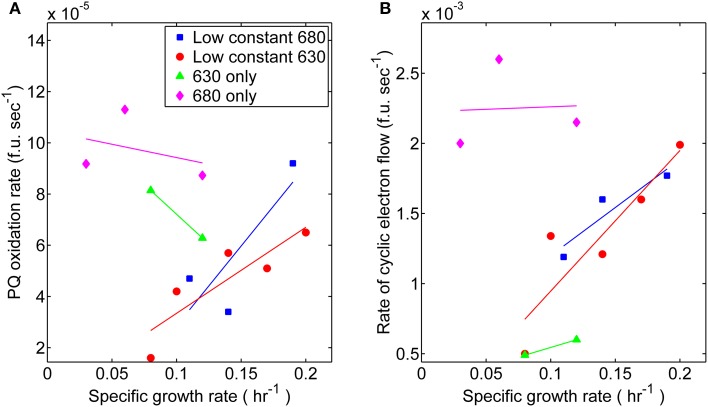
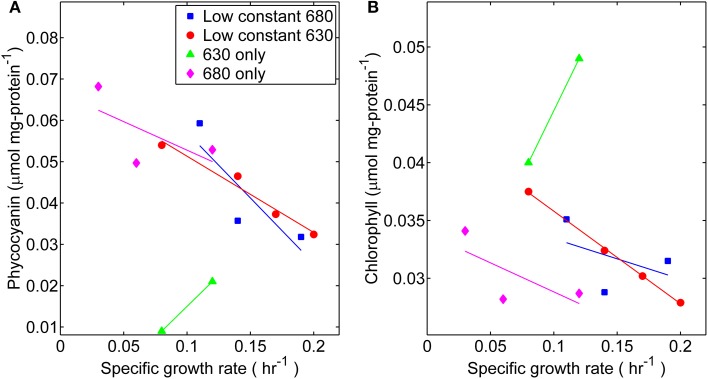
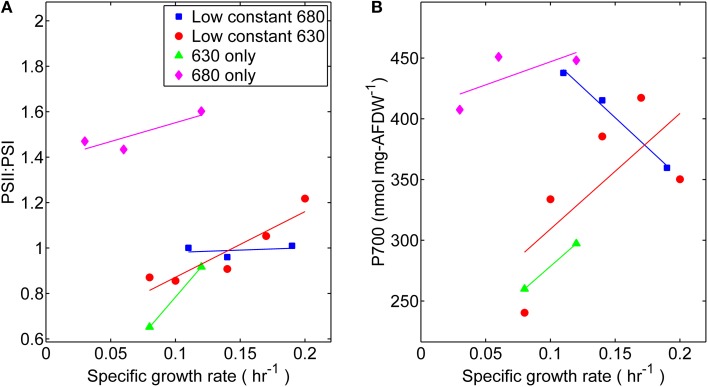
Synechococcus sp. PCC 7002 was grown to steady state in optically thin turbidostat cultures under conditions for which light quantity and quality was systematically varied by modulating the output of narrow-band LEDs. Cells were provided photons absorbed primarily by chlorophyll (680 nm) or phycocyanin (630 nm) as the organism was subjected to four distinct mono- and dichromatic regimes. During cultivation with dichromatic light, growth rates were generally proportional to the total incident irradiance at values <275 μmol photons m(-2) · s(-1) and were not affected by the ratio of 630:680 nm wavelengths. Notably, under monochromatic light conditions, cultures exhibited similar growth rates only when they were irradiated with 630 nm light; cultures irradiated with only 680 nm light grew at rates that were 60-70% of those under other light quality regimes at equivalent irradiances. The functionality of photosystem II and associated processes such as maximum rate of photosynthetic electron transport, rate of cyclic electron flow, and rate of dark respiration generally increased as a function of growth rate. Nonetheless, some of the photophysiological parameters measured here displayed distinct patterns with respect to growth rate of cultures adapted to a single wavelength including phycobiliprotein content, which increased under severely light-limited growth conditions. Additionally, the ratio of photosystem II to photosystem I increased ~40% over the range of growth rates, although cells grown with 680 nm light only had the highest ratios. These results suggest the presence of effective mechanisms which allow acclimation of Synechococcus sp. PCC 7002 acclimation to different irradiance conditions.

Keywords: chlorophyll; cyanobacteria; fluorescence; photosynthesis; phycobiliprotein; turbidostat.


Figures

Figure 1
Figure 1
Synechococcus 7002 was cultured under four distinct light regimes each corresponding to mono- or dichromatic irradiance: (□) 53 μmol photons m−2 · s−1 of 680 nm light plus variable amounts of 630 nm light, (◦) 50 μmol photons m−2 · s−1 of 630 nm light plus variable amounts of 680 nm light, (Δ) 630 nm light only, or (◊) 680 nm light only. (A) Steady-state specific growth rate measured as a function of scalar incident irradiance for Synechococcus 7002 turbidostat cultures. Data represents the mean from n > 300 data points collected through steady-state conditions; error bars represent ± 1 standard deviation. The slopes calculated from linear regression of the μ vs. Ii curve were (10−7 m2 μmol photons−1): 1.46 (53 μmol photons m−2 · s−1 of 680 nm plus variable of 630 nm), 1.48 (53 μmol photons m−2 · s−1 of 630 nm plus variable of 680 nm), 1.43 (680 nm only), and 1.88 (630 only; regression of only two data points). (B) The net flux of O2 (μmol O2 h−1 · mg−1AFDW) in turbidostat cultures, expressed as a function of specific growth rate.
Figure 2
Figure 2
Net rate of photosynthetic O2 evolution as a function of white light irradiance (PAR) for steady-state cultures sampled from the turbidostat with (■) 224 μmol photons m−2 · s−1 of 680 nm light only or (●) 49 and 52 μmol photons m−2 · s−1 of 630 and 680 nm light, respectively. The measurements were initiated within 5 min of reactor sampling.
Figure 3
Figure 3
Photosynthetic parameters derived from variable chlorophyll fluorescence measurements performed on samples harvested during turbidostat controlled steady-state at each respective light regime: (■) 53 μmol photons m−2 · s−1 of 680 nm light plus variable amounts of 630 nm light, (●) 50 μmol photons m−2 · s−1 of 630 nm light plus variable amounts of 680 nm light, (▲) 630 nm light only, or (♦) 680 nm light only. (A) Comparisons of effective PS II quantum yields (YII, given in relative units, r.u.) at different growth rates. (B) Comparisons of maximum relative electron transport rates (rETRmax) at different growth rates.
Figure 4
Figure 4
Photosynthetic parameters related to elements of photosynthesis downstream from PS II measured from steady-state cultures corresponding toeach respective light regime: (■) 53 μmol photons m−2 · s−1 of 680 nm light plus variable amounts of 630 nm light, (●) 50 μmol photons m−2 · s−1 of 630 nm light plus variable amounts of 680 nm light, (▲) 630 nm light only, or (♦) 680 nm light only. (A) Comparisons for the proxy rates of plastoquinone oxidation [fluorescent units (f.u.; measured in voltage) per second] in the dark measured for different growth rates. (B) Comparisons of proxy rates for cyclic electron flow (f.u. s−1) measured for different growth rates.
Figure 5
Figure 5
Comparisons of (A) phycocyanin content and (B) chlorophyll content (μmol per mg protein) at different specific growth rates. Samples were harvested directly from the turbidostat during steady-state growth corresponding to each light regime: (■) 53 μmol photons m−2 · s−1 of 680 nm light plus variable amounts of 630 nm light, (●) 50 μmol photons m−2 · s−1 of 630 nm light plus variable amounts of 680 nm light, (▲) 630 nm light only, or (♦) 680 nm light only.
Figure 6
Figure 6
Comparisons of (A) Photosystem II to Photosystem I ratios and (B) Photosystem I content per cell dry weight. Samples were harvested directly from the turbidostat during steady-state growth corresponding to each light regime: (■) 53 μmol photons m−2 · s−1 of 680 nm light plus variable amounts of 630 nm light, (●) 50 μmol photons m−2 · s−1 of 630 nm light plus variable amounts of 680 nm light, (▲) 630 nm light only, or (♦) 680 nm light only.

References

    1. Barber J., Andersson B. (1992). Too much of a good thing—light can be bad for photosynthesis. Trends Biochem. Sci. 17, 61–66 10.1016/0968-0004(92)90503-2 - DOI - PubMed
    1. Batterton J. C., Jr., Van Baalen C. (1971). Growth responses of blue-green algae to sodium chloride concentration. Arch. Mikrobiol. 76, 151–165 10.1007/BF00411789 - DOI - PubMed
    1. Bernstein H. C., Kesaano M., Moll K., Smith T., Gerlach R., Carlson R. P., et al. (2014). Direct measurement and characterization of active photosynthesis zones inside wastewater remediating and biofuel producing microalgal biofilms. Bioresour. Technol. 156, 206–215 10.1016/j.biortech.2014.01.001 - DOI - PubMed
    1. Bull A. T. (2010). The renaissance of continuous culture in the post-genomics age. J. Ind. Microbiol. Biotechnol. 37, 993–1021 10.1007/s10295-010-0816-4 - DOI - PubMed
    1. Burns R. A., Mac Kenzie T. D., Campbell D. A. (2006). Inorganic carbon repletion constrains steady-state light acclimation in the cyanobacterium Synechococcus elongatus. J. Phycol. 42, 610–621 10.1111/j.1529-8817.2006.00220.x - DOI - PubMed

LinkOut - more resources