. 2014 Oct 6;9(10):e108411.
doi: 10.1371/journal.pone.0108411. eCollection 2014.

Next-generation sequencing analysis of miRNA expression in control and FSHD myogenesis

Affiliations

Next-generation sequencing analysis of miRNA expression in control and FSHD myogenesis

Veronica Colangelo et al. PLoS One. .

Abstract

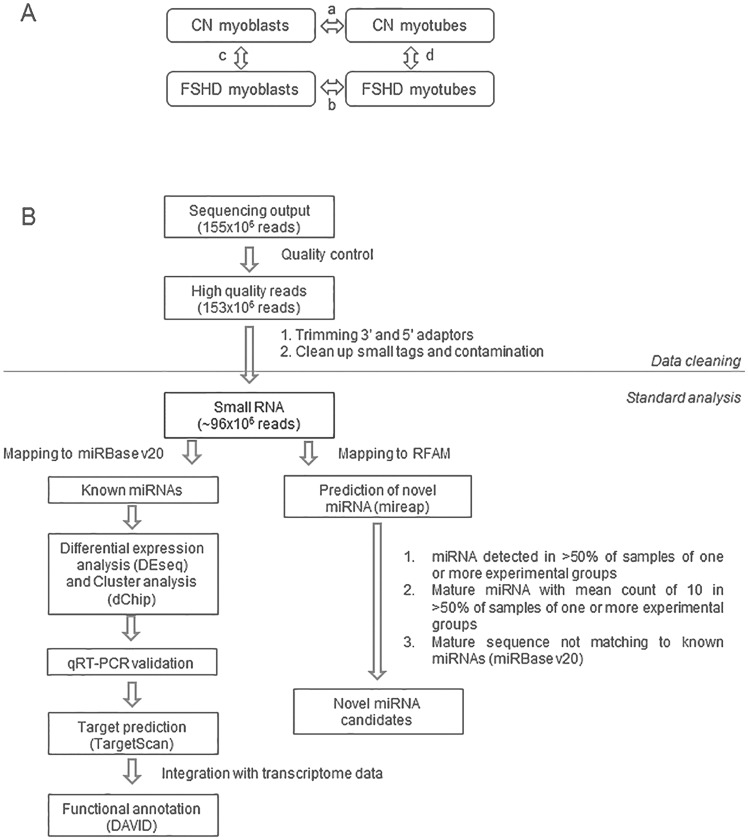
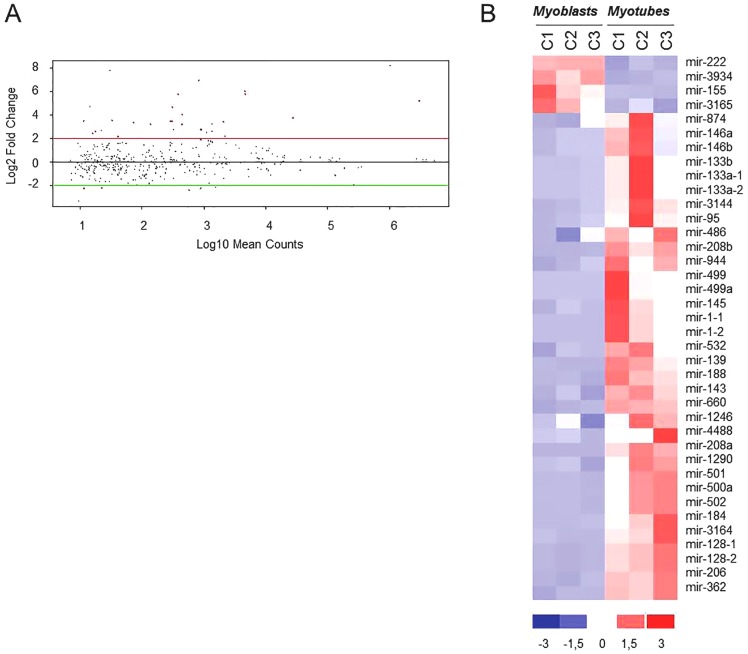
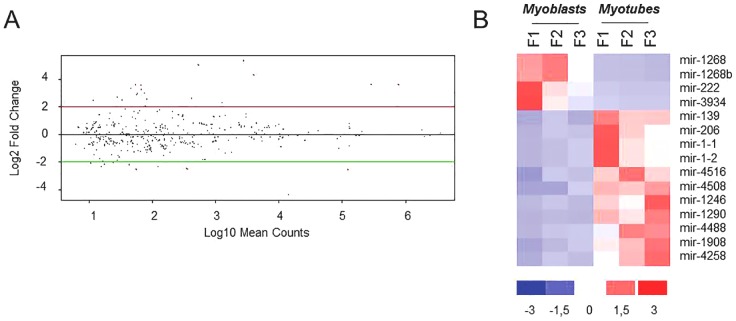
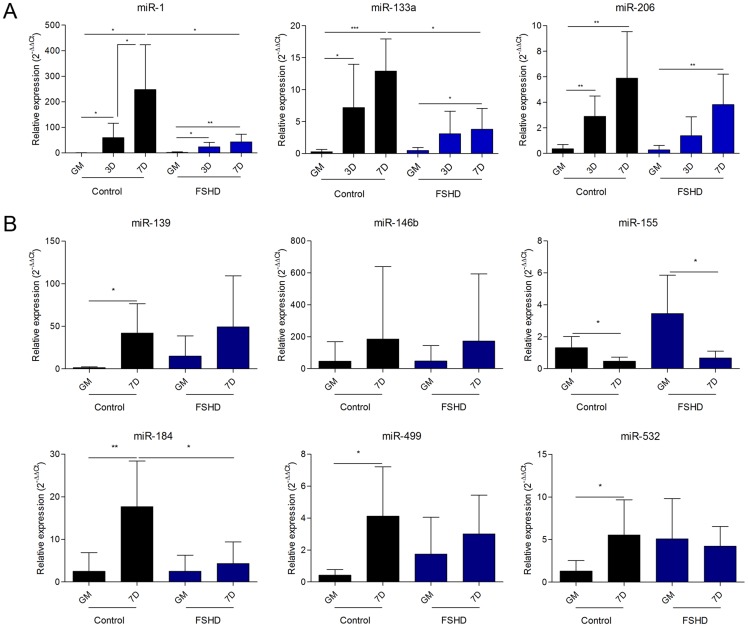
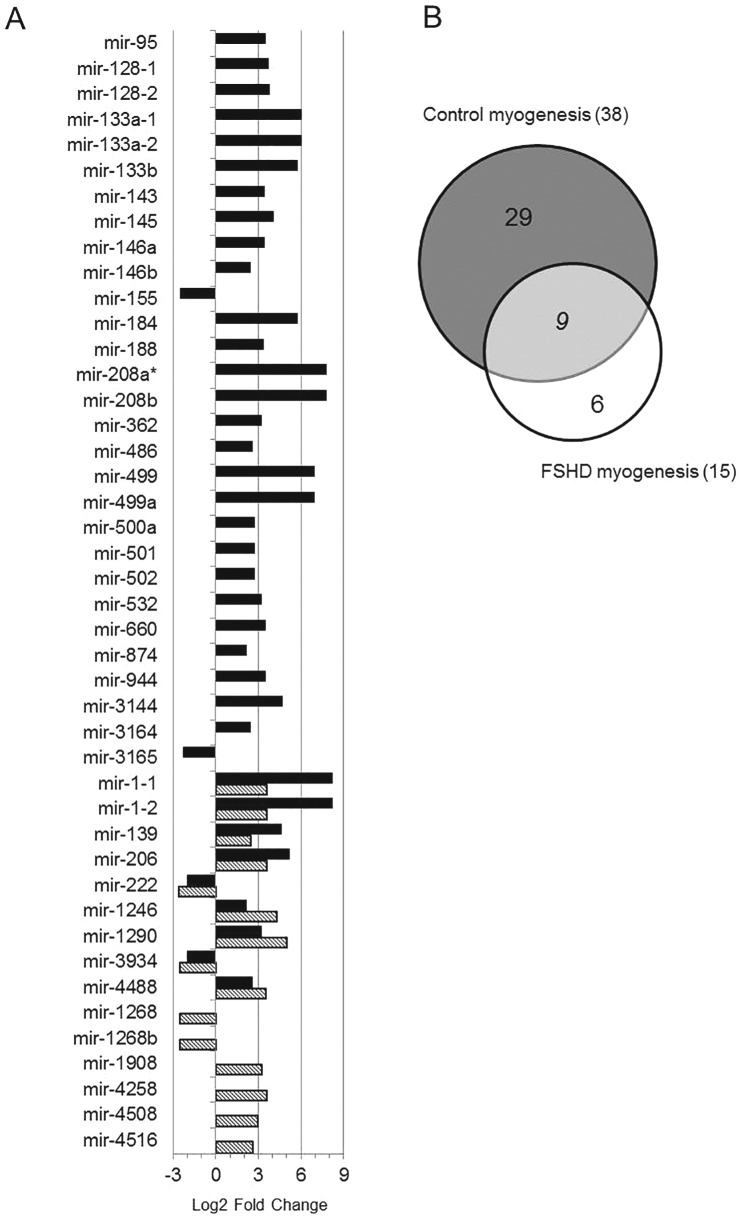
Emerging evidence has demonstrated that miRNA sequences can regulate skeletal myogenesis by controlling the process of myoblast proliferation and differentiation. However, at present a deep analysis of miRNA expression in control and FSHD myoblasts during differentiation has not yet been derived. To close this gap, we used a next-generation sequencing (NGS) approach applied to in vitro myogenesis. Furthermore, to minimize sample genetic heterogeneity and muscle-type specific patterns of gene expression, miRNA profiling from NGS data was filtered with FC ≥ 4 (log(2)FC ≥ 2) and p-value<0.05, and its validation was derived by qRT-PCR on myoblasts from seven muscle districts. In particular, control myogenesis showed the modulation of 38 miRNAs, the majority of which (34 out 38) were up-regulated, including myomiRs (miR-1, -133a, -133b and -206). Approximately one third of the modulated miRNAs were not previously reported to be involved in muscle differentiation, and interestingly some of these (i.e. miR-874, -1290, -95 and -146a) were previously shown to regulate cell proliferation and differentiation. FSHD myogenesis evidenced a reduced number of modulated miRNAs than healthy muscle cells. The two processes shared nine miRNAs, including myomiRs, although with FC values lower in FSHD than in control cells. In addition, FSHD cells showed the modulation of six miRNAs (miR-1268, -1268b, -1908, 4258, -4508- and -4516) not evidenced in control cells and that therefore could be considered FSHD-specific, likewise three novel miRNAs that seem to be specifically expressed in FSHD myotubes. These data further clarify the impact of miRNA regulation during control myogenesis and strongly suggest that a complex dysregulation of miRNA expression characterizes FSHD, impairing two important features of myogenesis: cell cycle and muscle development. The derived miRNA profiling could represent a novel molecular signature for FSHD that includes diagnostic biomarkers and possibly therapeutic targets.


Conflict of interest statement

Competing Interests: The authors have declared that no competing interests exist.

Figures

Figure 1
Figure 1. Study design and data analysis.
A) Study design: Next-generation Sequencing (NGS) on three control and three FSHD myoblast cell lines before and after in vitro myogenic differentiation was used in order to derive miRNA modulation in: a) control myogenesis (CN myotubes vs CN myoblasts; arrow a); b) FSHD myogenesis (FSHD myotubes vs FSHD myoblasts; arrow b); c) FSHD myoblasts versus control myoblast (arrow c), and d) FSHD myotubes vs control myotubes (arrow d). B) Flow chart of filtering and analysis of NGS data. NGS generated a total of 153×106 high quality reads, that were filtered for rRNA, tRNA, snRNA, snoRNA, repeat associated RNAs and intron/exon. The filtered reads (approx. 99×106 reads, an average of 8×10⁶/sample) were analyzed to derive known miRNAs (R/Bioconductor) and novel miRNAs (mireap). Differentially expressed miRNAs between samples were derived by log2FC≧2 and p-value<0.05 parameters. The homogeneity of miRNA modulation among samples was evaluated by cluster analysis (dChip). miRNAs were then validated by qRT-PCR. Finally, target genes were predicted for modulated miRNAs and functionally annotated by DAVID.
Figure 2
Figure 2. MiRNA modulation in control myogenesis.
A) DEseq analysis of miRNAs differentially expressed in control myotubes vs control myoblasts (control differentiation). MiRNAs showing a modulation with log2FC≥2 and a p-value<0.05 are shown as red dots. B) Hierarchical clustering of the 38 modulated miRNAs (34 up-regulated and 4 down-regulated) in regard to the analyzed samples. C1:MX01010MBS; C2: MX03609MBS; C3: MX01110MBS, Control cell lines (see Table S1).
Figure 3
Figure 3. MiRNA modulation in FSHD myogenesis.
A) DEseq analysis of miRNAs differentially expressed in FSHD myotubes vs FSHD myoblasts (FSHD differentiation). MiRNAs showing a modulation with log2FC≥2 and a p-value<0.05 are shown as red dots. B) Hierarchical clustering of the 15 modulated miRNAs (11 up-regulated and 4 down-regulated) in regard to the analyzed samples. F1:MX00409MBS; F2: MX03010MBS; F3:MX04309MBS, FSHD cell lines (see Table S1).
Figure 4
Figure 4. MiRNA dysregulation in FSHD myotubes.
A) DEseq analysis of miRNAs differentially expressed in FSHD myotubes vs control myotubes. MiRNAs showing a differential expression of log2FC≥2 and a p-value<0.05 are shown as red dots. B) Hierarchical clustering of the 21 modulated miRNAs (12 up-regulated and 9 down-regulated) in regard to the analyzed samples. C1:MX01010MBS; C2: MX03609MBS; C3: MX01110MBS, Control cell lines; F1:MX00409MBS; F2: MX03010MBS; F3:MX04309MBS, FSHD cell lines (see Table S1).
Figure 5
Figure 5. Validation of NGS data.
A) qRT-PCR analysis of myomiRs (miR-1, miR-133a and miR-206) during control and FSHD myogenesis at 0, 3 and 7 days of differentiation. B) qRT-PCR analysis of six microRNAs modulated in control and/or FSHD myogenesis. GM: growth medium; 3D: 3 days of differentiation; 7D: 7 days of differentiation. * p-value<0.05; ** p-value<0.01; *** p-value<0.001.
Figure 6
Figure 6. Comparison of miRNA modulation in control and FSHD myogenesis.
A) Black and striped bars identify the Fold Change of miRNAs modulated respectively, in control and FSHD myogenesis. Bars on the left and on the right represent, respectively, down- and up-regulated miRNAs. *hsa-mir-208a showed infinite FC value (see Table S3). B) Venn diagram showing the number of miRNAs unique to FSHD (white) or control (grey), and shared (light grey) by FSHD and control differentiation processes.

References

    1. Padberg GW, Lunt PW, Koch M, Fardeau M (1992) Diagnostic criteria for facioscapulohumeral muscular dystrophy. Neuromuscul Disord 1: 231–4. - PubMed
    1. Tupler R, Gabellini D (2004) Molecular basis of facioscapulohumeral muscular dystrophy. Cell Mol Life Sci 61: 557–66. - PMC - PubMed
    1. Wijmenga C, Hewitt JE, Sandkuijl LA, Clark LN, Wright TJ, et al. (1992) Chromosome 4q DNA rearrangements associated with facioscapulohumeral muscular dystrophy. Nature Genetics 2: 26–30. - PubMed
    1. Yamanaka G, Goto K, Ishihara T, Oya Y, Miyajima T, et al. (2004) FSHD-like patients without 4q35 deletion. J Neurol Sci 219: 89–93. - PubMed
    1. Arashiro P, Eisenberg I, Kho AT, Cerqueira AM, Canovas M, et al. (2009) Transcriptional regulation differs in affected facioscapulohumeral muscular dystrophy patients compared to asymptomatic related carriers. Proc Natl Acad Sci USA 106: 6220–5. - PMC - PubMed

Publication types

MeSH terms

Associated data