. 2014 Oct 6;9(10):e109126.
doi: 10.1371/journal.pone.0109126. eCollection 2014.

Effects of extreme climate events on tea (Camellia sinensis) functional quality validate indigenous farmer knowledge and sensory preferences in tropical China

Affiliations

Effects of extreme climate events on tea (Camellia sinensis) functional quality validate indigenous farmer knowledge and sensory preferences in tropical China

Selena Ahmed et al. PLoS One. .

Abstract

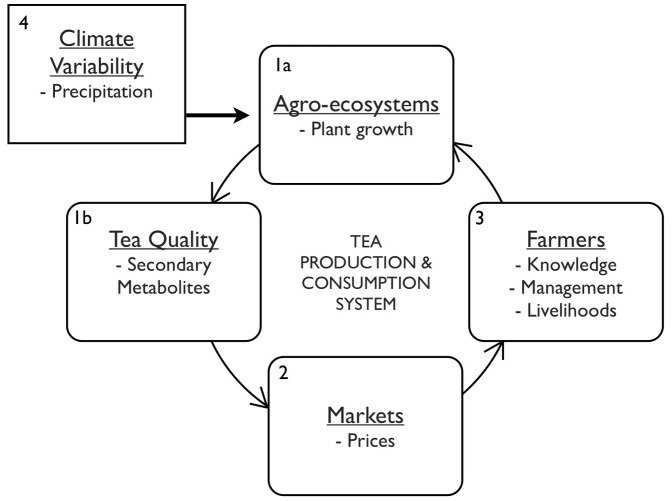
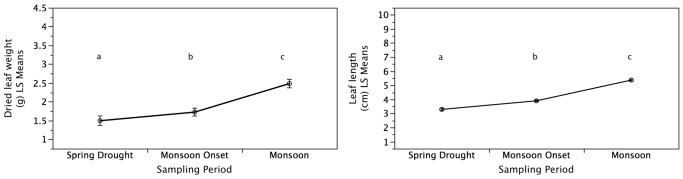
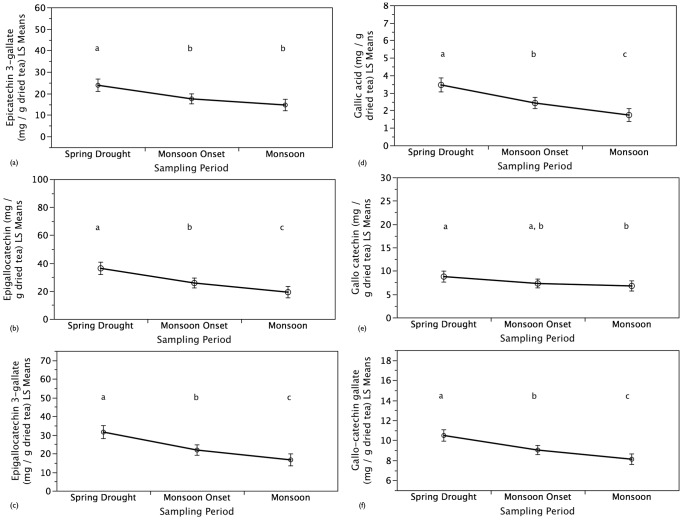
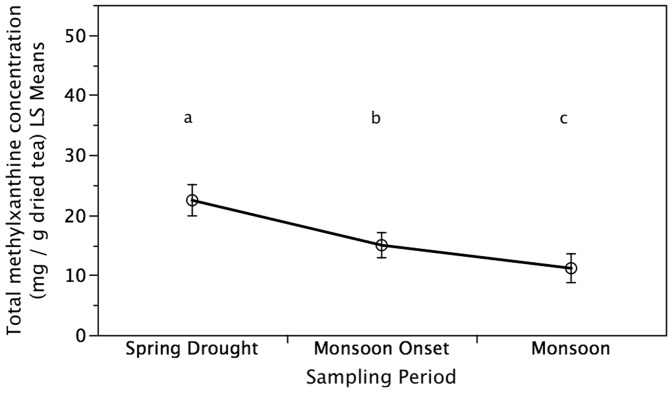
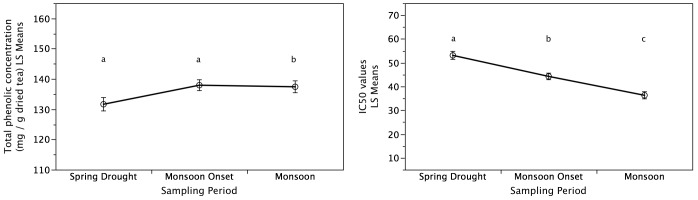
Climate change is impacting agro-ecosystems, crops, and farmer livelihoods in communities worldwide. While it is well understood that more frequent and intense climate events in many areas are resulting in a decline in crop yields, the impact on crop quality is less acknowledged, yet it is critical for food systems that benefit both farmers and consumers through high-quality products. This study examines tea (Camellia sinensis; Theaceae), the world's most widely consumed beverage after water, as a study system to measure effects of seasonal precipitation variability on crop functional quality and associated farmer knowledge, preferences, and livelihoods. Sampling was conducted in a major tea producing area of China during an extreme drought through the onset of the East Asian Monsoon in order to capture effects of extreme climate events that are likely to become more frequent with climate change. Compared to the spring drought, tea growth during the monsoon period was up to 50% higher. Concurrently, concentrations of catechin and methylxanthine secondary metabolites, major compounds that determine tea functional quality, were up to 50% lower during the monsoon while total phenolic concentrations and antioxidant activity increased. The inverse relationship between tea growth and concentrations of individual secondary metabolites suggests a dilution effect of precipitation on tea quality. The decrease in concentrations of tea secondary metabolites was accompanied by reduced farmer preference on the basis of sensory characteristics as well as a decline of up to 50% in household income from tea sales. Farmer surveys indicate a high degree of agreement regarding climate patterns and the effects of precipitation on tea yields and quality. Extrapolating findings from this seasonal study to long-term climate scenario projections suggests that farmers and consumers face variable implications with forecasted precipitation scenarios and calls for research on management practices to facilitate climate adaptation for sustainable crop production.


Conflict of interest statement

Competing Interests: The authors have declared that no competing interests exist.

Figures

Figure 1
Figure 1. Tea Production and Consumption System.
Our study objectives are to examine the tea production and consumption system on the basis of the following dimensions: (1) effects of precipitation variability between an extreme drought that occurred during the dry spring tea harvest season and monsoon tea harvest season on growth and functional quality of tea leaves, (2) tea prices during the dry spring tea harvest season and monsoon tea harvest season, (3) farmer knowledge of climate effects on tea quality and associated management, sensory preferences, and livelihoods and, (4) precipitation trends over the past 40 years as well as forecasted precipitation at the study site.
Figure 2
Figure 2. Effects of Precipitation Variability on Tea Growth.
Increased precipitation from the spring drought to the monsoon tea harvest significantly increased tea leaf weight and length. Sampling periods not connected by the same letters are significantly different. Values are means ± one standard error.
Figure 3
Figure 3. Effects of Precipitation Variability on Tea Polyphenolic Catechins.
Increased precipitation from the spring drought to the monsoon tea harvest resulted in significantly lower concentrations of (a) epicatechin 3-gallate (ECG), (b) epigallocatechin 3-gallate (EGCG), (c) epigallocatechin (EGC), (d) gallic acid (GA), (e) gallocatechin (GC), (f) gallocatechin gallate (GCG) as well as catechin (C) and catechin gallate (CG; not shown). Sampling periods not connected by the same letters are significantly different. Values are means ± one standard error.
Figure 4
Figure 4. Effects of Precipitation Variability on Total Methylxanthine Concentration.
Increased precipitation from the spring drought to the monsoon tea harvest resulted in significantly lower total methylxanthine concentration (TMC) of tea leaves. Sampling periods not connected by the same letters are significantly different. Values are means ± one standard error.
Figure 5
Figure 5. Effects of Precipitation Variability on Total Phenolic Concentration and Antioxidant Activity.
Increased precipitation from the spring drought to the monsoon tea harvest resulted in significantly higher total phenolic concentration (TMC) and antioxidant activity of tea leaves. Sampling periods not connected by the same letters are significantly different. Values are means ± one standard error.
Figure 6
Figure 6. Effects of Precipitation Variability on Tea Prices.
Farmers at the study site have experienced an average decrease of 51% in on-farm tea prices received during the Monsoon tea harvests compared to the dry spring tea harvests.
Figure 7
Figure 7. Increased Inter-annual Variability and Total Precipitation.
Precipitation data at the study site shows inter-annual variability from 1979 through 2010. The shaded section of the figure represents the period comprising 90% of annual rainfall. In addition to increasing variability since 1990, the monsoon season is arriving earlier as indicated by the downward shift of the trend line.
Figure 8
Figure 8. Historical Precipitation Trends During the Dry Spring and Monsoon Tea Harvests.
Comparison of average rain rate for dry spring (top) and monsoon (bottom) tea harvests during the following periods: a) 1979–1984, b) 1985–1989, c) 1990–1994, d) 1995–1999, e) 2000–2004, f) 2005–2010. The study site is located at the dot in the middle of each map.

References

    1. Porter JR, Semenov MA (2005) Crop responses to climatic variation. Philos Trans R Soc Lond B Biol Sci 360: 2021–2035. - PMC - PubMed
    1. Lobell DB, Schlenker W, Costa-Roberts J (2011) Climate trends and global crop production since 1980. Science 333: 616–620. - PubMed
    1. Ewert F, Rounsevell MDA, Reginster I, Metzger MJ, Leemans R (2005) Future scenarios of European agricultural land use I. Estimating changes in crop productivity. Agr Ecosyst Environ 107: 101–116.
    1. Nelson GC, Rosegrant MW, Koo J, Robertson R, Sulser T, et al.. (2009) Climate change: Impact on agriculture and costs of adaptation. Food Policy Report, Briefing Series Number 21 International Food Policy Research Institute. Washington, D.C. http://dx.doi.org/10.2499/0896295354 - DOI
    1. Schlenker W, Lobell DB (2010) Robust negative impacts of climate change on African agriculture. Environ Res Lett 5

Publication types