. 2014 Oct 7:12:171.
doi: 10.1186/s12916-014-0171-9.

Standard laboratory tests to identify older adults at increased risk of death

Affiliations

Standard laboratory tests to identify older adults at increased risk of death

Susan E Howlett et al. BMC Med. .

Abstract

Background: Older adults are at an increased risk of death, but not all people of the same age have the same risk. Many methods identify frail people (that is, those at increased risk) but these often require time-consuming interactions with health care providers. We evaluated whether standard laboratory tests on their own, or added to a clinical frailty index (FI), could improve identification of older adults at increased risk of death.

Methods: This is a secondary analysis of a prospective cohort study, where community dwelling and institutionalized participants in the Canadian Study of Health and Aging who also volunteered for blood collection (n = 1,013) were followed for up to six years. A standard FI (FI-CSHA) was constructed from data obtained during the clinical evaluation and a second, novel FI was constructed from laboratory data plus systolic and diastolic blood pressure measurements (FI-LAB). A combined FI included all items from each index. Predictive validity was tested using Cox proportional hazards analysis and discriminative ability by the area under receiver operating characteristic (ROC) curves.

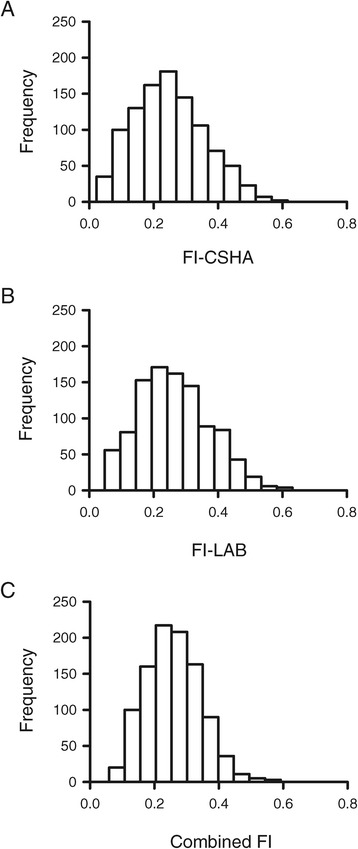
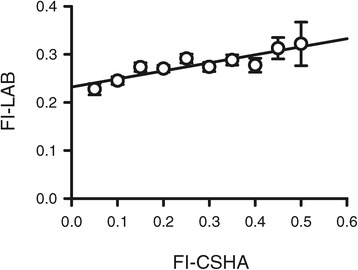
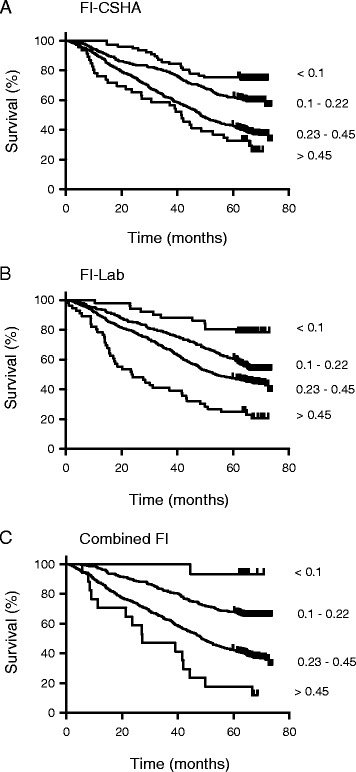
Results: Of 1,013 participants, 51.3% had died by six years. The mean baseline value of the FI-LAB was 0.27 (standard deviation 0.11; range 0.05 to 0.63), the FI-CSHA was 0.25 (0.11; 0.02 to 0.72), and the combined FI was 0.26 (0.09; 0.06 to 0.59). In an age- and sex-adjusted model, with each increment in the FI-LAB, the hazard ratios increased by 2.8% (95% confidence interval 1.02 to 1.04). The hazard ratios for the FI-CSHA and the combined FI were 1.02 (1.01 to 1.03) and 1.04 (1.03 to 1.05), respectively. The FI-LAB and FI-CSHA remained independently associated with death in the face of the other. The areas under the ROC curves were 0.72 for FI-LAB, 0.73 for FI-CSHA and 0.74 for the combined FI.

Conclusions: An FI based on routine laboratory data can identify older adults at increased risk of death. Additional evaluation of this approach in clinical settings is warranted.


Figures

Figure 1
Figure 1
Frequency distributions for the FI-CSHA and the FI-LAB. A) The frequency distribution for the FI-CSHA data was somewhat skewed to the left, with a median of 0.24 and a long right tail. The maximum FI-CSHA score was 0.72. B) Histogram showing the frequency distribution for the FI-LAB data collected in this study. The distribution had a median FI-LAB value of 0.27 and the maximum observed FI-LAB score was 0.63. C) The distribution of the combined FI scores was slightly skewed to the left, with a median value of 0.26 and a maximum of 0.59. The value of n = 1,013 participants in each group. FI-CSHA, standard frailty index; FI-LAB, laboratory frailty index.
Figure 2
Figure 2
Relationship between the FI-CSHA and the FI-LAB. FI-LAB values were plotted as a function of the FI-CSHA scores. The FI-CSHA scores were pooled and the means (±SEM) are shown in increments of 0.05. The FI-LAB increased as FI-CSHA scores increased (P <0.001). The data were fit with a linear regression as described in the methods and were a good fit to a straight line (r2 = 0.81). FI-CSHA, standard frailty index; FI-LAB, laboratory frailty index; SEM, standard error of the mean.
Figure 3
Figure 3
Kaplan-Meier survival curves for grades of the FI. A) Survival over the course of the study plotted as a function of grades of the FI-CSHA. The least frail group (frailty score <0.10) showed little mortality over the course of the study whereas the most frail group (frailty score >0.45) showed very high mortality. Differences between groups were statistically significant between all four grades of frailty when analyzed with a log-rank test (P <0.05). B) Survival curves for grades of frailty assessed by the FI-LAB scores. There were significant differences in survival between subjects at all four levels when FI-LAB scores were used to grade frailty (P <0.05; log rank test). C) Kaplan-Meier survival curves for ‘combined’ FI scores obtained by merging the FI-CSHA and the FI-LAB scores. Differences in mortality between the four grades of frailty were most evident when the combination FI scores were used (P <0.05; log rank test). FI-CSHA, standard frailty index; FI-LAB, laboratory frailty index.

Similar articles

Cited by

References

    1. Clegg Al, Young J, Iliffe S, Rikkert MO, Rockwood K. Frailty in elderly people. Lancet. 2013;381:752–762. doi: 10.1016/S0140-6736(12)62167-9. - DOI - PMC - PubMed
    1. Vellas B, Cestac P, Morley JE. Implementing frailty into clinical practice: we cannot wait. J Nutr Health Aging. 2012;16:599–600. doi: 10.1007/s12603-012-0096-y. - DOI - PubMed
    1. Rodríguez-Mañas L, Féart C, Mann G, Viña J, Chatterji S, Chodzko-Zajko W, Gonzalez-Colaço Harmand M, Bergman H, Carcaillon L, Nicholson C, Scuteri A, Sinclair A, Pelaez M, Van der Cammen T, Beland F, Bickenbach J, Delamarche P, Ferrucci L, Fried LP, Gutiérrez-Robledo LM, Rockwood K, Rodríguez Artalejo F, Serviddio G, Vega E, FOD-CC group (Appendix 1) Searching for an operational definition of frailty: a Delphi method based consensus statement: the frailty operative definition-consensus conference project. J Gerontol A Biol Sci Med Sci. 2013;68:62–67. doi: 10.1093/gerona/gls119. - DOI - PMC - PubMed
    1. Dent E, Chapman I, Howell S, Piantadosi C, Visvanathan R. Frailty and functional decline indices predict poor outcomes in hospitalised older people. Age Ageing. 2014;43:477–484. doi: 10.1093/ageing/aft181. - DOI - PubMed
    1. Evans SJ, Sayers M, Mitnitski A, Rockwood K. The risk of adverse outcomes in hospitalized older patients in relation to a frailty index based on a comprehensive geriatric assessment. Age Ageing. 2014;43:127–132. doi: 10.1093/ageing/aft156. - DOI - PubMed

Publication types

LinkOut - more resources