. 2014 Oct 20;211(11):2213-30.
doi: 10.1084/jem.20131371. Epub 2014 Oct 6.

Myeloproliferative neoplasms can be initiated from a single hematopoietic stem cell expressing JAK2-V617F

Affiliations

Myeloproliferative neoplasms can be initiated from a single hematopoietic stem cell expressing JAK2-V617F

Pontus Lundberg et al. J Exp Med. .

Abstract

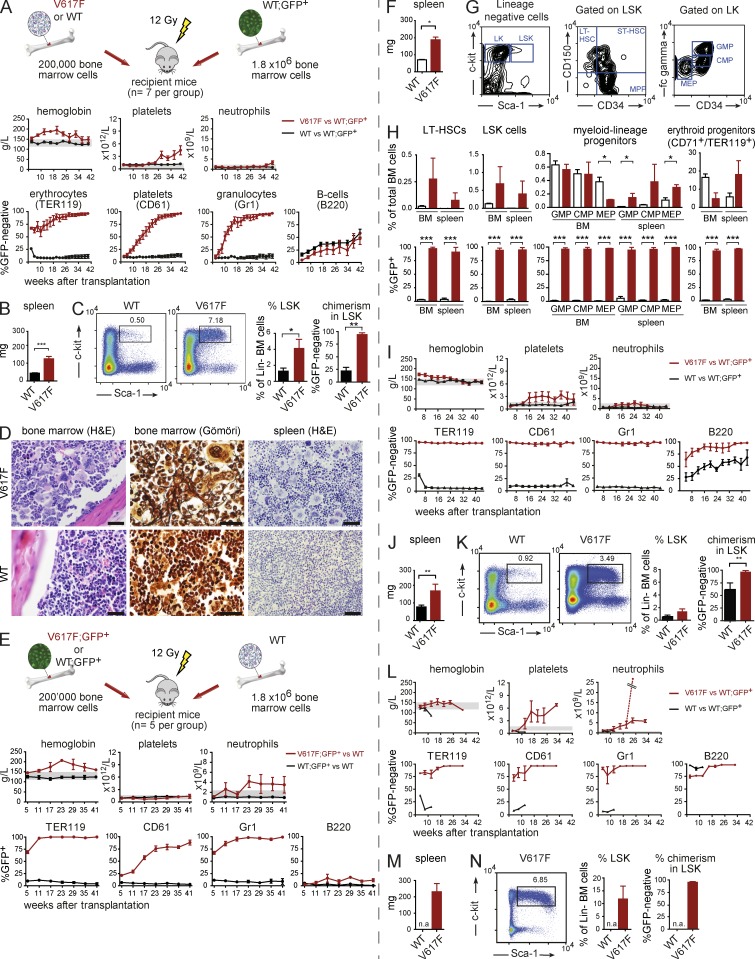
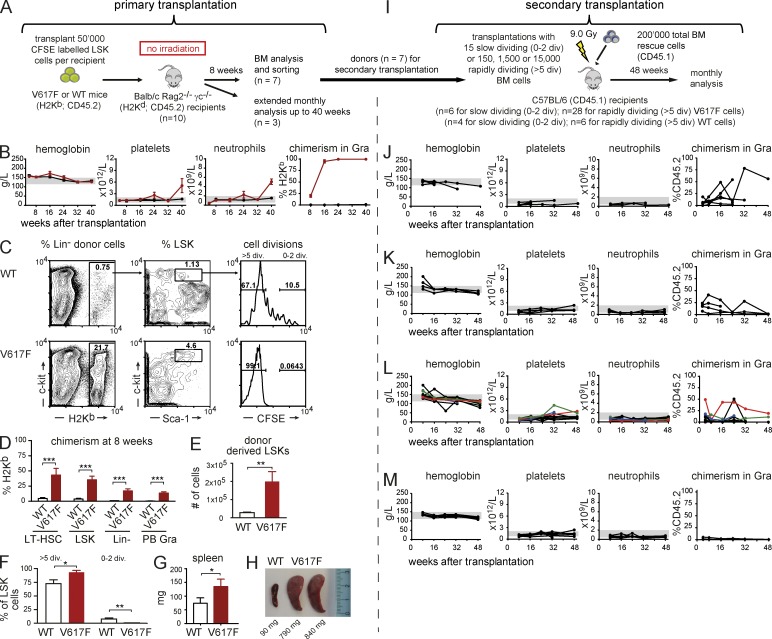
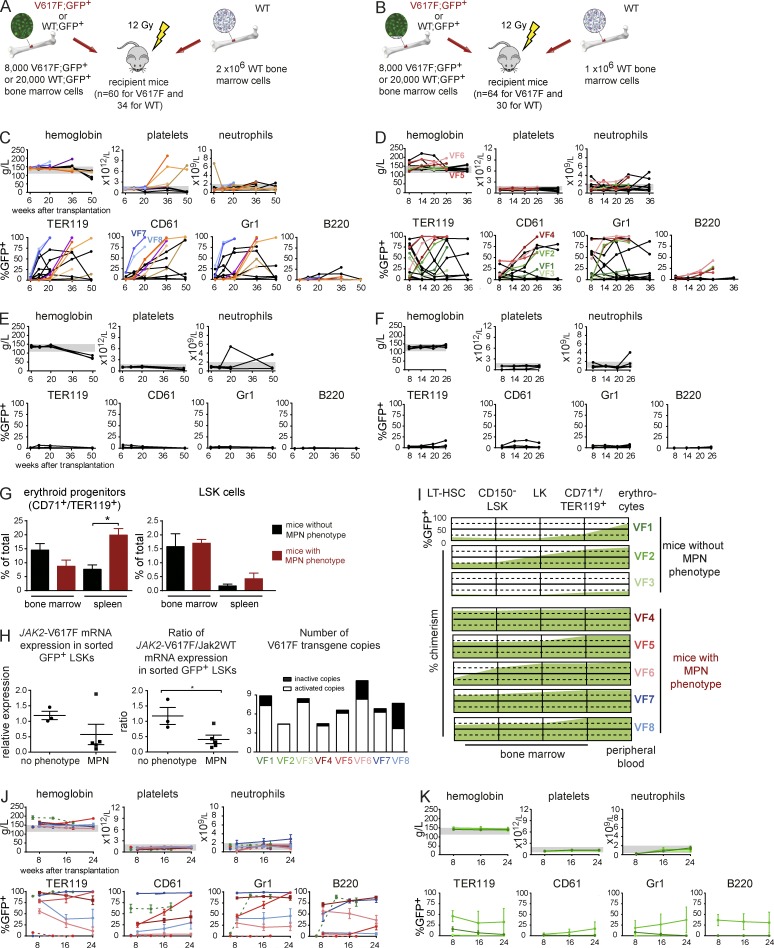
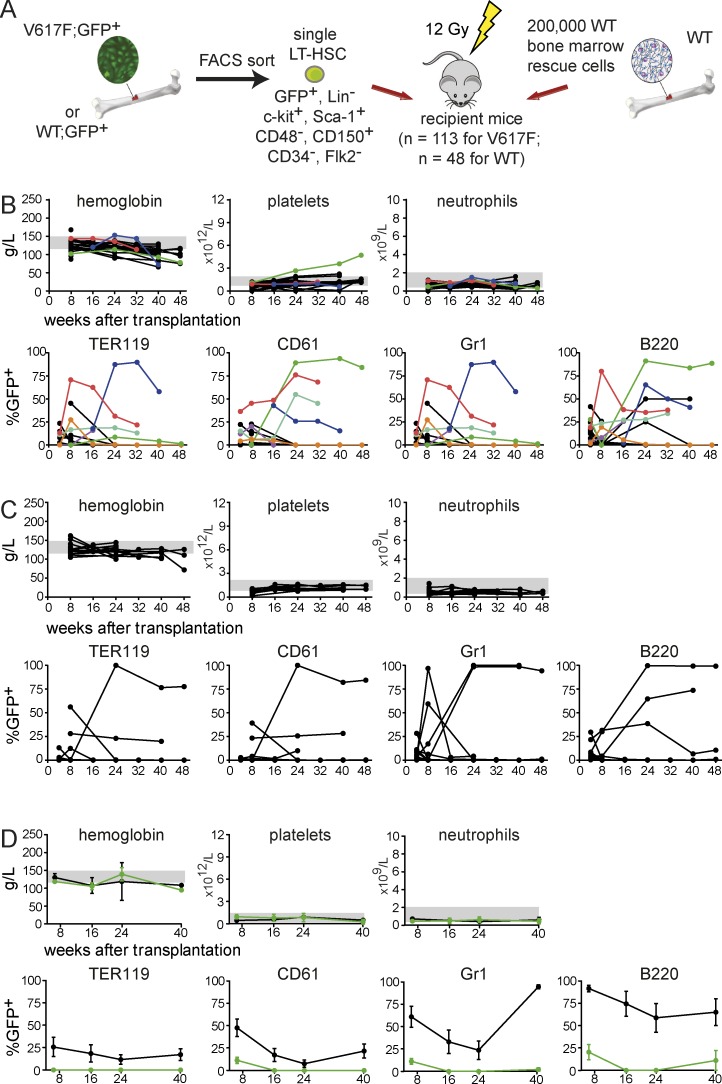
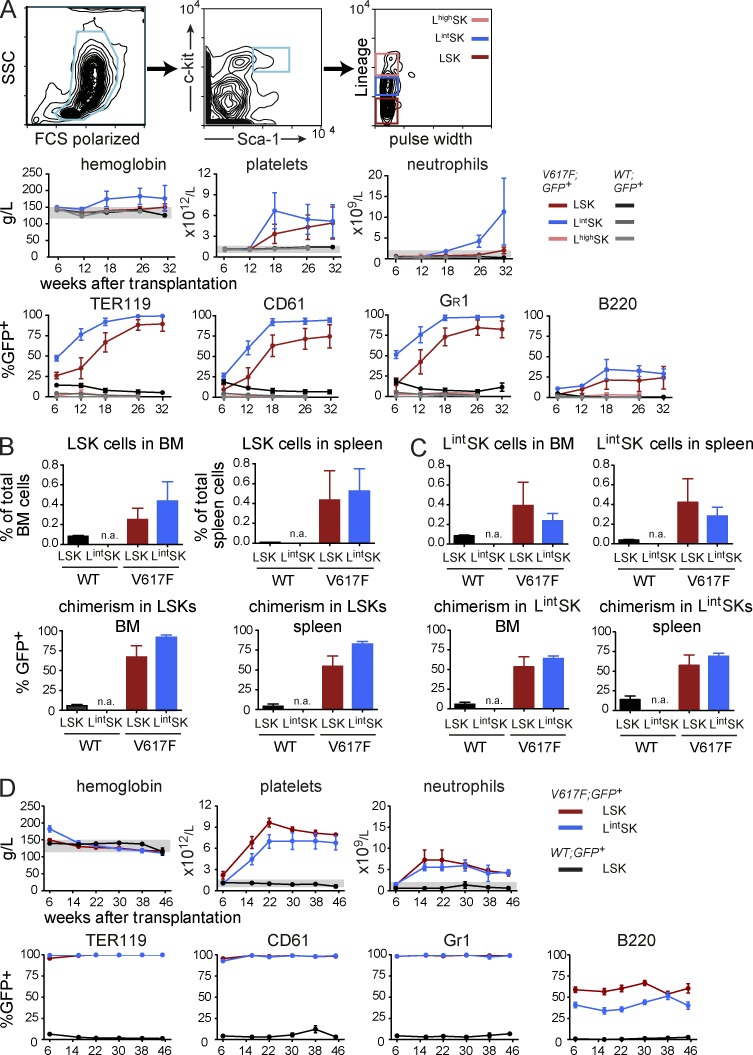
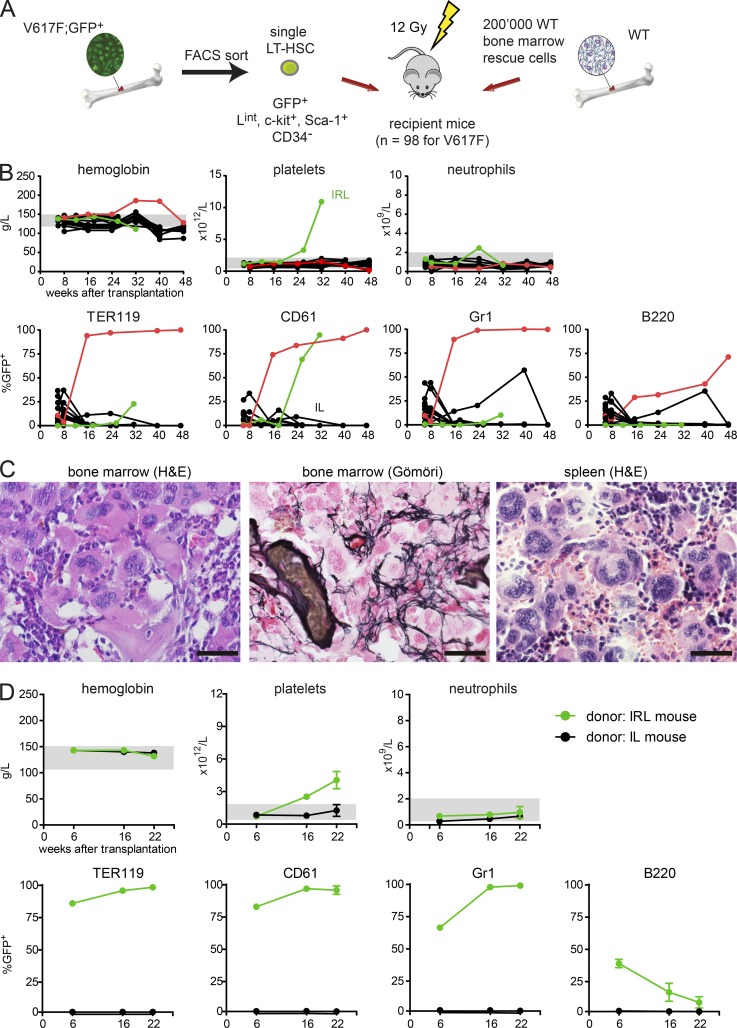
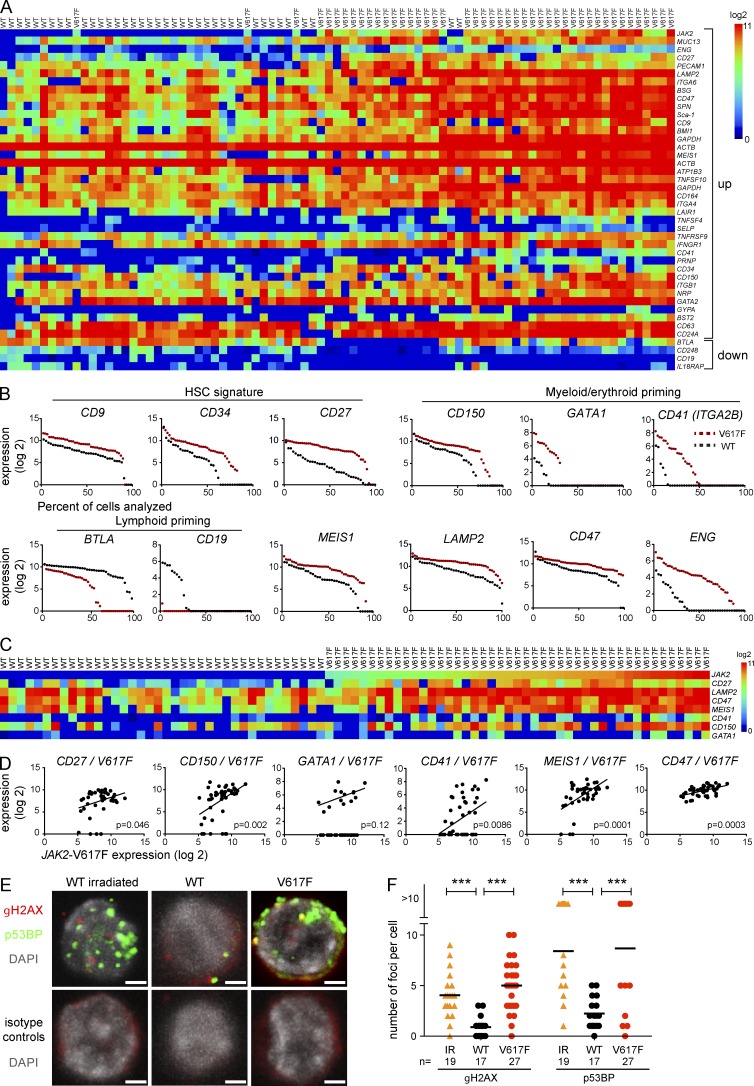
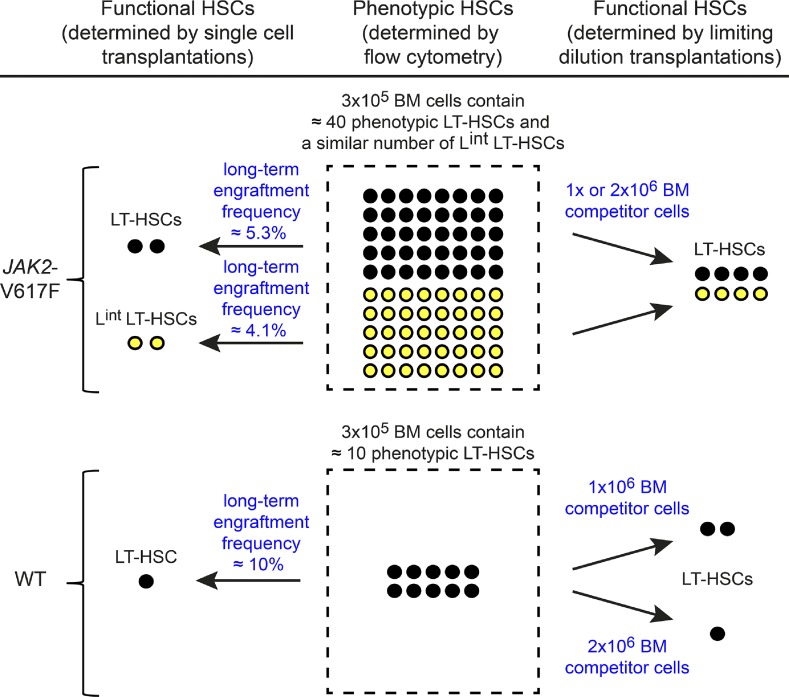
The majority of patients with myeloproliferative neoplasms (MPNs) carry a somatic JAK2-V617F mutation. Because additional mutations can precede JAK2-V617F, it is questioned whether JAK2-V617F alone can initiate MPN. Several mouse models have demonstrated that JAK2-V617F can cause MPN; however, in all these models disease was polyclonal. Conversely, cancer initiates at the single cell level, but attempts to recapitulate single-cell disease initiation in mice have thus far failed. We demonstrate by limiting dilution and single-cell transplantations that MPN disease, manifesting either as erythrocytosis or thrombocytosis, can be initiated clonally from a single cell carrying JAK2-V617F. However, only a subset of mice reconstituted from single hematopoietic stem cells (HSCs) displayed MPN phenotype. Expression of JAK2-V617F in HSCs promoted cell division and increased DNA damage. Higher JAK2-V617F expression correlated with a short-term HSC signature and increased myeloid bias in single-cell gene expression analyses. Lower JAK2-V617F expression in progenitor and stem cells was associated with the capacity to stably engraft in secondary recipients. Furthermore, long-term repopulating capacity was also present in a compartment with intermediate expression levels of lineage markers. Our studies demonstrate that MPN can be initiated from a single HSC and illustrate that JAK2-V617F has complex effects on HSC biology.


Figures

Figure 1.
Figure 1.
Competitive transplantations with JAK2-V617F (V617F) and WT BM cells. (A–D) Transplantation experiments in which GFP is expressed in the WT competitor cells, allowing indirect monitoring of the mutant allele burden. The experiment was performed twice, total n = 12 mice per group, one experiment with n = 7 is shown. (A) Schematic drawing showing the design of the experiment. The time course of PB parameters and chimerism were determined for the erythroid (TER119), platelet (CD61), granulocytic (Gr1), and B cell (B220) lineages. (B) Spleen weight at terminal workup at 40 wk (n = 7 per group). (C) Flow cytometry scattergrams showing the LSK gating. The bar graphs show the percentages of LSKs in lineage-negative cells in the BM and the chimerism within the LSK population (n = 5 per group). (D) Histopathology taken at 40 wk after transplantation (one representative mouse per group is shown). Bars, 50 µm. (E–H) Transplantation experiments in which V617F and GFP is coexpressed in the same cells, allowing direct monitoring of the mutant allele burden. The experiment was performed twice, total n = 10 of which one experiment is shown (n = 5). (E) Schematic drawing of the experimental design and results of blood counts and chimerism are shown. (F) Spleen weight at terminal workup at 41 wk (n = 5 for WT and n = 2 for V617F). (G) Gating strategy for the quantification of myeloid progenitors and HSCs. (H) Flow cytometry quantification of progenitor and stem cell populations in BM and spleen at 41 wk after transplantation (n = 5 for WT and n = 2 for V617F). (I–K) Transplantation of BM from experiment A into secondary recipients (n = 5 recipients per group, the experiment was performed once). (I) Blood counts and chimerism are shown. (J) Spleen weight of secondary recipients at 44 wk (n = 5 per group). (K) Gating and quantification of LSK cells and chimerism within the LSK population (n = 5 per group). (L–N) Transplantation of BM from experiment I into tertiary recipients (n = 5 recipients per group, the experiment was performed once). (L) Blood counts and chimerism are shown. The dashed line represents one mouse that developed a marked neutrophilia. (M) Spleen weight of tertiary recipients taken at 32 wk after transplantation (n = 3). (N) Gating and quantification of LSK cells and chimerism within the LSK population (for quantification n = 3). Statistical analysis was conducted using the Student’s t test or one-way ANOVA with Bonferroni’s post-hoc multiple comparison test. Error bars represent ±SEM. *, P < 0.05; **, P < 0.01; ***, P < 0.001. n.a., not available.
Figure 2.
Figure 2.
Analysis of cell cycling of BM progenitor cells transplanted into nonconditioned immune-compromised BALB/c Rag2−/− γc−/− recipients. (A) Schematic drawing of the experimental setup (3 independent experiments, total n = 10 per group). At 8 wk, 7 mice per group were sacrificed and analyzed in detail (C–G), whereas the remaining 3 mice per group were kept for long-term analysis of blood counts, chimerism, and spleen size (B and H). (B) Time course of blood counts and chimerism in granulocytes for primary recipients. (C) Representative scattergrams showing gating strategy for chimerism and CFSE dilution analyses. (D) Quantification of chimerism, with the averages of 7 WT mice and 7 V617F mice in selected BM populations. (E) Numbers of donor-derived LSKs (n = 7 per group). (F) The percentages of LSKs with >5 cell divisions or 0–2 divisions. (G) Spleen weight at terminal workup 8 wk after transplantation (n = 7 per group). (H) Spleens at 40 wk after transplantation. (I) Schematic drawing of the experimental setup for secondary transplantations. (J) Blood counts and chimerism of secondary recipients receiving 15 slow-dividing (0–2 divisions) V617F LSKs per recipient competing with 2 × 10⁵ WT BM rescue cells. Results of 3 independent experiments, total n = 6. (K) Same as in J, but with 15 slow-dividing WT cells. Total n = 4. (L) Blood counts and chimerism of secondary recipients receiving 150, 1,500, or 15,000 rapidly dividing V617F LSKs (>5 divisions) competing with 2 × 10⁵ WT BM cells. Results of 3 independent experiments, total n = 28 and total n = 6 (M) for recipients of WT cells. Statistical analysis was conducted using either Student’s t test, or one-way ANOVA with Bonferroni’s post-hoc multiple comparison test. *, P < 0.05; **, P < 0.01; ***, P < 0.001.
Figure 3.
Figure 3.
Competitive transplantations at limiting dilutions. (A and B) Schematic drawing of the 1:250 and 1:125 limiting dilution experiments (4 limiting dilution experiments were performed, n = 30–64 mice per group, see Table 1). (C and D). Blood counts and PB chimerism of the 1:250 and 1:125 transplantations. Mice showing elevated blood counts were individually colored. (E and F) Blood counts and PB chimerism in mice transplanted with 20,000 WT;GFP+ BM cells at 1:100 and 1:50 dilutions. (G) Analysis of CD71+/TER119+ erythroid progenitors and LSKs in BM and spleen are shown as percentages of all BM cells or percentage of lineage-negative cells, respectively (n = 3–5 mice per group). (H) Quantification of JAK2-V617F expression in GFP+ LSKs (n = 3–5 mice per group) shown either as expression compared with the Gusb gene (left) or as a ratio between human JAK2-V617F and mouse WT Jak2 mRNA expression (middle). The right panel shows the copy number and proportion of the activated V617F transgene in LSK cells. (I) Graph showing the engraftment of V617F;GFP+ cells at different stages of HSC, progenitor, or erythroid cell differentiation. The percentages of GFP+ cells indicate the size of the JAK2-V617F clone for nonphenotypic mice at the top (VF1-3) and mice that developed an MPN phenotype below (VF4-8). VF1-VF6 mice are from the experiment displayed in D, whereas mice VF7 and VF8 are from the experiment in C. (J) Blood counts and chimerism of secondary recipients transplanted with BM cells from donors that displayed an MPN phenotype. BM for secondary transplantation was taken from mice VF4-8 or from 3 additional mice (dotted lines) that were transplanted at 1:100 dilution in a separate experiment (see Table 1; n = 4 per group). (K) Blood counts and chimerism of secondary recipients of BM cells from donor mice that did not display MPN phenotype. BM from the 3 primary recipients VF1, VF2, and VF3 was transplanted into (n = 4 per group). Statistical analysis was conducted using Student’s t test. Error bars represent ±SEM. *, P < 0.05.
Figure 4.
Figure 4.
Competitive transplantations with single HSCs. (A) Schematic drawing of the experimental setup. Data from four independent transplantations for the V617F;GFP+ group (total n = 113) and for the WT;GFP+ group (total n = 48) is shown. (B) Blood counts and chimerism for mice transplanted with a single V617F;GFP+ LT-HSC. Individual mice that displayed chimerism >1% are color coded. (C) Blood counts and chimerism for mice transplanted with a single WT;GFP+ LT-HSC. (D) Secondary recipients (n = 4 per group) of BM from the mouse with ET phenotype in B (green symbols) and from a WT control mouse with the highest chimerism taken from the group displayed in C.
Figure 5.
Figure 5.
Comparison of competitive advantage and disease initiating capacity between different subsets of FACS-sorted progenitor cells. (A) Mice were transplanted with either 1,000 LSKs (dark red color), 1,000 lineage-intermediate (Lint) SK cells (blue color), or 1,000 lineage-positive (Lhigh) SK cells (pink color) that were mixed with 1 × 10⁶ WT BM competitor cells (GFP-negative). Blood counts and chimerism, presented as the percentage of GFP+ cells, are shown (the experiment was performed twice, total n = 10 per group). (B) Quantification of LSKs in spleen and BM, and assessment of GFP chimerism in these populations (n = 5 per group). (C) Quantification of LintSK cells in spleen and BM, and assessment of GFP chimerism in these populations (n = 5 per group). (D) Transplantation of BM into secondary recipients. BM cells (2 × 10⁶) from primary hosts were harvested at 32 wk, pooled, and transplanted into secondary recipients (n = 5 mice per group in two independent experiments). Statistical analysis was conducted using Student’s t test. Error bars represent ±SEM.
Figure 6.
Figure 6.
Competitive transplantation of sorted single cells with intermediate expression of lineage markers (Lint). (A) Schematic drawing of the experimental setup. Lethally irradiated recipient mice were transplanted with a single V617F;GFP+ Lint LT-HSC (n = 98, in 2 independent experiments) mixed with 2 × 10⁵ WT competitor cells. (B) Blood counts and chimerism of mice transplanted with a single V617F;GFP+ cell. (C) Histopathology at 32 wk after transplantation of mouse IRL that displayed an ET phenotype. Bars, 50 µm. (D) Secondary recipients (n = 3) of BM from the mouse IRL with ET in Fig. 6 B (green symbols) and a control littermate with low chimerism.
Figure 7.
Figure 7.
Characterization of JAK2-V617F LT-HSCs by single-cell expression profiling. (A) Heat map of the hierarchical clustering showing expression levels of all genes differentially expressed between FACS-sorted V617F and WT single cells with a cutoff of P ≤ 0.01. Top rows show genes up-regulated in V617F cells and bottom rows genes that are down-regulated. Data from two independent experiments are shown (total n = 38 for WT cells and n = 45 for V617F cells). (B) Expression levels and percentages of expressing cells of selected genes implicated in self-renewal and myeloid/lymphoid priming. Dots represent single cells and they are arranged according to decreasing expression. (C) Genes whose expression levels correlated with expression levels of JAK2-V617F. (D) Correlations between up-regulated genes and V617F. (E) DNA damage in LT-HSCs from V617F mice and controls. Immunofluorescence images of nuclei showing γH2AX and p53BP foci in LT-HSCs from irradiated WT mice, WT controls, and V617F mice are shown. LT-HSC from WT and JAK2-V617F mice were co-stained with antibodies against p53BP and γH2AX (top) or isotype matched antibodies (bottom). Nuclei were counterstained with DAPI. As a positive control, LSKs were isolated from mice 1 h after 2Gy irradiation (IR). Images of cells were acquired on confocal microscopy and numbers of foci within nuclei were counted. Bars, 2 µm. (F) Quantification of the numbers of γH2AX and p53BP foci. Data from one experiment is shown, n = 19 (irradiated control), n = 17 (WT control), and n = 27 (V617F). Statistical analysis was conducted using Wilcoxon, Mann-Whitney Test, one-way ANOVA with Bonferroni’s post-hoc multiple comparison, or Student’s t test. ***, P ≤ 0.001.
Figure 8.
Figure 8.
Summary of the observed numeric alterations in the HSC compartment of JAK2-V617F mice. The middle panel shows the numbers of phenotypic LT-HSCs (black circles) per 3 × 10⁵ BM cells (dashed box), as determined by flow cytometric analysis. V617F mice also have LT-HSCs with intermediate expression levels of lineage markers (Lint) that are capable of long-term engraftment (yellow circles). Lint LT-HSCs with long-term engraftment potential do not exist in WT mice. The left panel shows the numbers of functional HSCs per 3 × 10⁵ BM cells calculated from transplantations of sorted single cells using the frequencies of long-term engraftment (derived from Tables 2 and 3). The right panel shows the number of functional LT-HSCs per 3 × 10⁵ BM cells derived from limiting dilution transplantations and calculated by Poisson distribution (see Table 1).

References

    1. Abdel-Wahab, O., Pardanani A., Rampal R., Lasho T.L., Levine R.L., and Tefferi A.. 2011. DNMT3A mutational analysis in primary myelofibrosis, chronic myelomonocytic leukemia and advanced phases of myeloproliferative neoplasms. Leukemia. 25:1219–1220. 10.1038/leu.2011.82 - DOI - PMC - PubMed
    1. Akada, H., Yan D., Zou H., Fiering S., Hutchison R.E., and Mohi M.G.. 2010. Conditional expression of heterozygous or homozygous Jak2V617F from its endogenous promoter induces a polycythemia vera-like disease. Blood. 115:3589–3597. 10.1182/blood-2009-04-215848 - DOI - PMC - PubMed
    1. Baxter, E.J., Scott L.M., Campbell P.J., East C., Fourouclas N., Swanton S., Vassiliou G.S., Bench A.J., Boyd E.M., Curtin N., et al. . Cancer Genome Project. 2005. Acquired mutation of the tyrosine kinase JAK2 in human myeloproliferative disorders. Lancet. 365:1054–1061. 10.1016/S0140-6736(05)71142-9 - DOI - PubMed
    1. Beer, P.A., Jones A.V., Bench A.J., Goday-Fernandez A., Boyd E.M., Vaghela K.J., Erber W.N., Odeh B., Wright C., McMullin M.F., et al. . 2009. Clonal diversity in the myeloproliferative neoplasms: independent origins of genetically distinct clones. Br. J. Haematol. 144:904–908. 10.1111/j.1365-2141.2008.07560.x - DOI - PubMed
    1. Benz, C., Copley M.R., Kent D.G., Wohrer S., Cortes A., Aghaeepour N., Ma E., Mader H., Rowe K., Day C., et al. . 2012. Hematopoietic stem cell subtypes expand differentially during development and display distinct lymphopoietic programs. Cell Stem Cell. 10:273–283. 10.1016/j.stem.2012.02.007 - DOI - PubMed

Publication types

MeSH terms

LinkOut - more resources