

Acute hospital care is the chief driver of regional spending variation in Medicare patients with advanced cancer
- PMID: 25288424
- PMCID: PMC4203442
- DOI: 10.1377/hlthaff.2014.0280
Acute hospital care is the chief driver of regional spending variation in Medicare patients with advanced cancer
Abstract
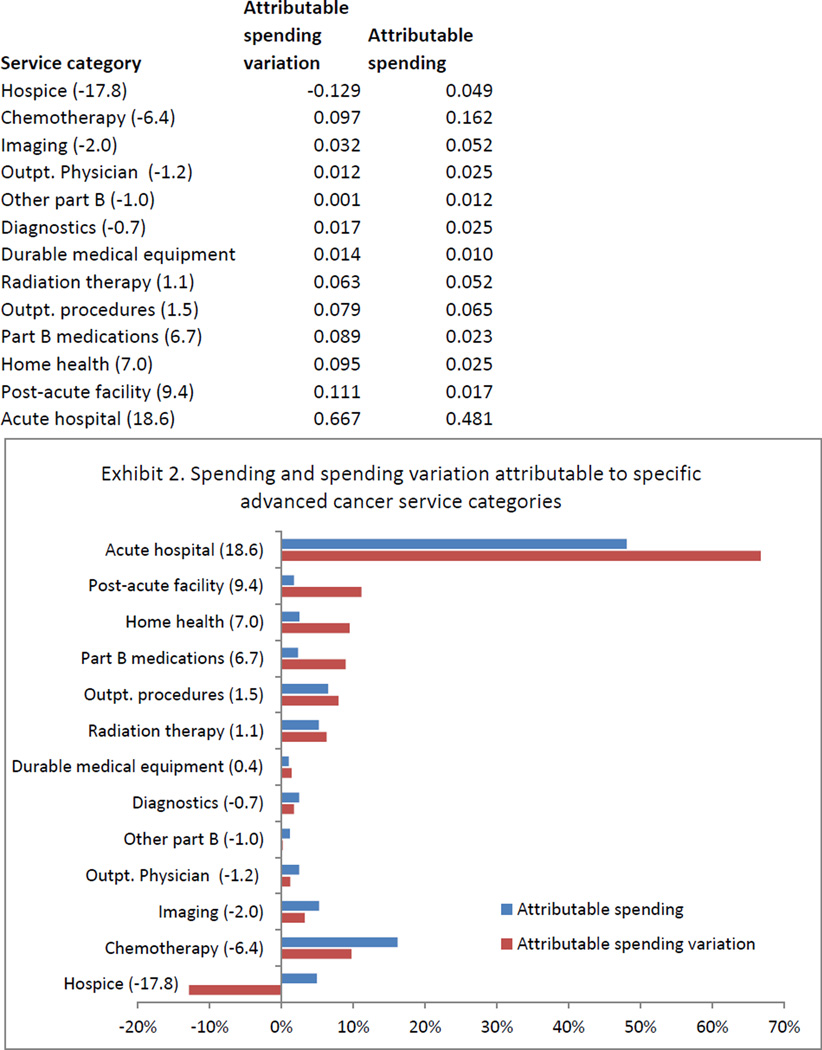
The root causes of regional variation in medical spending are poorly understood and vary by clinical condition. To identify drivers of regional spending variation for Medicare patients with advanced cancer, we used linked Surveillance, Epidemiology, and End Results program (SEER)-Medicare data from the period 2004-10. We broke down Medicare spending into thirteen cancer-relevant service categories. We then calculated the contribution of each category to spending and regional spending variation. Acute hospital care was the largest component of spending and the chief driver of regional spending variation, accounting for 48 percent of spending and 67 percent of variation. In contrast, chemotherapy accounted for 16 percent of spending and 10 percent of variation. Hospice care constituted 5 percent of spending. However, variation in hospice spending was fully offset by opposing variation in other categories. Our analysis suggests that the strategy with the greatest potential to improve the value of care for patients with advanced cancer is to reduce reliance on acute hospital care for this patient population.
Keywords: Chronic Care; Health Spending; Medicare; Organization and Delivery of Care; Variations.
Project HOPE—The People-to-People Health Foundation, Inc.
Figures
References
-
- Fisher ES, Wennberg DE, Stukel TA, Gottlieb DJ, Lucas FL, Pinder EL. The implications of regional variations in Medicare spending. Part 1: the content, quality, and accessibility of care. Ann Intern Med. 2003;138(4):273–287. - PubMed
-
- Fisher ES, Wennberg DE, Stukel TA, Gottlieb DJ, Lucas FL, Pinder EL. The implications of regional variations in Medicare spending. Part 2: health outcomes and satisfaction with care. Ann Intern Med. 2003;138(4):288–298. - PubMed
-
- Baicker K, Chandra A. Medicare spending, the physician workforce, and beneficiaries’ quality of care. Health Aff (Millwood) 2004;23(Suppl):w4-184–w4-197. - PubMed
-
- Reschovsky JD, Ghosh A, Stewart KA, Chollet DJ. Durable medical equipment and home health among the largest contributors to area variations in use of Medicare services. Health Aff (Millwood) 2012;31(5):956–964. - PubMed
Publication types
MeSH terms
Grants and funding
LinkOut - more resources
Full Text Sources
Other Literature Sources
Medical
Molecular Biology Databases