. 2014 Dec;34(24):4404-19.
doi: 10.1128/MCB.01066-14. Epub 2014 Oct 6.

Genetic dissection of the vav2-rac1 signaling axis in vascular smooth muscle cells

Affiliations

Genetic dissection of the vav2-rac1 signaling axis in vascular smooth muscle cells

Salvatore Fabbiano et al. Mol Cell Biol. 2014 Dec.

Abstract

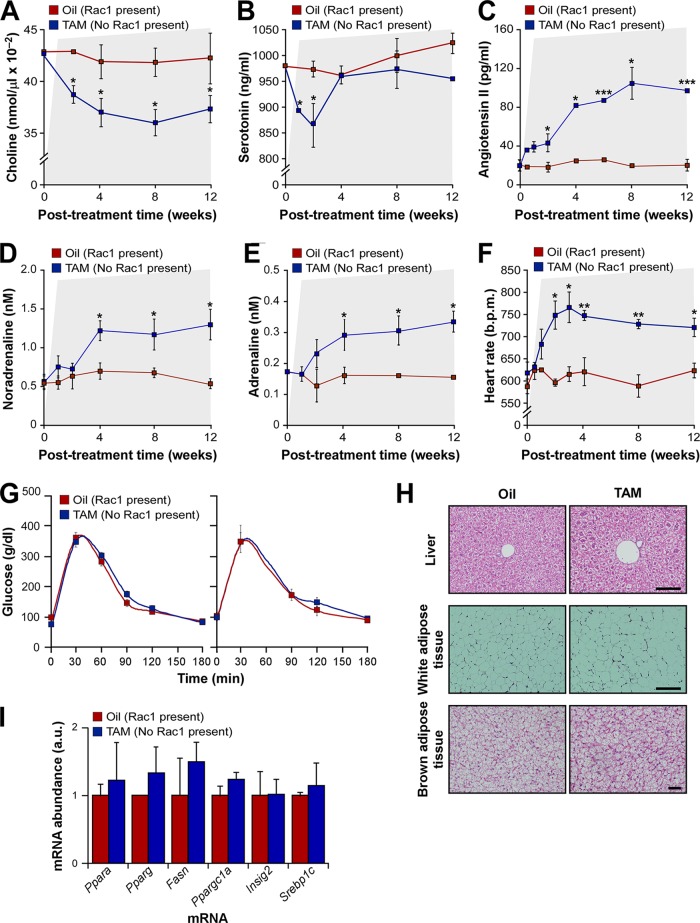
Vascular smooth muscle cells (vSMCs) are key in the regulation of blood pressure and the engagement of vascular pathologies, such as hypertension, arterial remodeling, and neointima formation. The role of the Rac1 GTPase in these cells remains poorly characterized. To clarify this issue, we have utilized genetically engineered mice to manipulate the signaling output of Rac1 in these cells at will using inducible, Cre-loxP-mediated DNA recombination techniques. Here, we show that the expression of an active version of the Rac1 activator Vav2 exclusively in vSMCs leads to hypotension as well as the elimination of the hypertension induced by the systemic loss of wild-type Vav2. Conversely, the specific depletion of Rac1 in vSMCs causes defective nitric oxide vasodilation responses and hypertension. Rac1, but not Vav2, also is important for neointima formation but not for hypertension-driven vascular remodeling. These animals also have allowed us to dismiss etiological connections between hypertension and metabolic disease and, most importantly, identify pathophysiological programs that cooperate in the development and consolidation of hypertensive states caused by local vascular tone dysfunctions. Finally, our results suggest that the therapeutic inhibition of Rac1 will be associated with extensive cardiovascular system-related side effects and identify pharmacological avenues to circumvent them.


Figures

FIG 1
FIG 1
Constitutive activation of Vav2 catalytic activity in vSMCs leads to hypotension. (A) Strategy used to generate the inducible (a) and constitutive (b) OncoVav2 mouse strains used in this work. The targeting vector is shown at the top. See details in the text. UTR, untranslated region; 3× HA, triple HA epitope; hGHpA, human growth hormone polyadenylation regions; ES, embryonic stem; TAM, tamoxifen. (B) Scheme of the vSMC-specific depletion of Rac1 in Myh11-Rac1flox/flox mice. (C) Abundance of wild-type Vav2 and OncoVav2 transcripts in aortas obtained from wild-type (WT) and inducible Myh11-OncoVav2 mice treated as indicated. Values are shown relative to the abundance obtained for the wild-type Vav2 mRNA in aortas from Vav2+/+ animals (which was given an arbitrary value of 1). a.u., arbitrary units. **, P ≤ 0.01; ***, P ≤ 0.001 (n = 3). (D to F) Mean arterial pressure (D and E) and heart rate (F) present in control and Myh11-OncoVav2 mice at the indicated ages. In panel D, the two alternative periods of injections with either oil or tamoxifen in normotensic and hypertensive periods of mice are depicted as shaded gray areas and are labeled with a circled “a” and “b”, respectively. P ≤ 0.05 (*), P ≤ 0.01 (**), and P ≤ 0.001 (***) relative to oil-injected mice in each injection protocol (n = 6). M.A.P., mean arterial pressure; b.p.m., beats per minute. (G) Scheme of the Vav2 expression patterns in wild-type and C-OncoVav2 mice. (H to J) Mean arterial pressure (H and I) and heart rate (J) of 8-week-old mice of the indicated genotypes. C-OncoVav2, mice homozygous for the OncoVav2 allele; OncoVav2/−, mice containing an OncoVav2 allele and a null Vav2 allele. **, P ≤ 0.01 compared to values obtained from wild-type mice (n = 4). Error bars represent the standard errors of the means (SEM).
FIG 2
FIG 2
Deletion of Rac1 in vSMCs leads to hypertension and loss of cardiovascular homeostasis. (A) Abundance of the indicated transcripts in aortas obtained from Myh11-Rac1flox/flox mice 3 weeks after being subjected to injections with either corn oil (Oil) or tamoxifen (TAM). Values obtained for each transcript in control mice were given an arbitrary value of 1. ***, P ≤ 0.001 relative to the appropriate control (n = 5). (B) Changes in the number of copies of Rac1 (left) and Rac2 (right) mRNAs in 4OHT-treated primary vSMCs maintained in cell culture. (C) Abundance of the indicated proteins and phosphoproteins (arrows) in total tissue extracts from aortas obtained from Myh11-Rac1flox/flox mice that were treated as described for panel A. Data obtained in two independent experiments are shown. Abundance of tubulin α was used as a loading control (bottom panels). p, phosphorylated. (D) Evolution of the mean arterial pressure of Myh11-Rac1flox/flox mice before (shaded area; negative numbers) and after (nonshaded area; positive numbers) five consecutive injections (indicated by arrows) of either oil or tamoxifen. The zero time point indicates the final injection time. P ≤ 0.05 (*) and P ≤ 0.001 (***) relative to oil-injected mice (n = 6). (E and F) Systolic (S.A.P.) (E) and diastolic (D.A.P.) (F) arterial pressure in Myh11-Rac1flox/flox mice 3 weeks after the indicated treatments. **, P ≤ 0.01 relative to control mice (n = 4). (G) Heart rate of Myh11-Rac1flox/flox mice 3 weeks after the indicated treatments. *, P ≤ 0.05 relative to oil-injected mice (n = 6). (H and I) Mean aorta medium wall size (H) and cell area of left ventricle cardiomyocytes (I) present in Myh11-Rac1flox/flox mice 3 weeks after final oil and tamoxifen injections. **, P ≤ 0.01 relative to oil-injected mice (n = 6). (J) Representative examples of hematoxylin-eosin-stained sections obtained from the indicated tissues of Myh11-Rac1flox/flox mice in the experiment shown in panels G and H. Scale bars, 100 μm. (K) Amount of fibrosis in the indicated tissues from Myh11-Rac1flox/flox mice 3 weeks after final oil and tamoxifen injections. **, P ≤ 0.01 relative to oil-injected mice (n = 4). (L) Abundance of the indicated transcripts in aortas obtained from Myh11-Cdc42floxflox mice 3 weeks after being subjected to injections with either oil or tamoxifen. Values obtained for each transcript in control mice were given an arbitrary value of 1. ***, P ≤ 0.001 relative to the appropriate control (n = 4). (M) Comparison of the mean arterial pressure of oil- and tamoxifen-treated Myh11-Cdc42floxflox mice. **, P ≤ 0.01 relative to control mice (n = 8). Error bars represent the SEM. The difference in basal blood pressure between control Myh11-Cdc42flox/flox and Myh11-Rac1flox/flox mice probably is due to their different genetic backgrounds.
FIG 3
FIG 3
Vav2-Rac1 axis of vSMCs is important for acetylcholine-dependent vasodilation responses. (A and B) Contractile response to the indicated concentrations of phenylephrine (A) and 5-hydroxytryptamine (B) of mesenteric arteries isolated from 2-month-old Myh11-OncoVav2 mice subjected 3 weeks before to injections with either oil or tamoxifen. *, P ≤ 0.001 for the fit of the concentration-response curves to those for control mesenteric arteries (n = 4 and 6 for oil- and tamoxifen-treated mice, respectively). (C) Relaxation response to the indicated concentrations of acetylcholine of mesenteric arteries isolated as indicated for panels A and B. *, P ≤ 0.001 for the fit of the concentration-response curves to those of control mesenteric arteries (n = 4 and 6 for oil- and tamoxifen-treated mice, respectively). (D to G) Contractile response to the indicated concentrations of phenylephrine (D), 5-hydroxytryptamine (E), a thromboxane A2 receptor agonist (U46619) (F), and endothelin-1 (G) of mesenteric arteries isolated from 2-month-old Myh11-Rac1flox/flox mice that were subjected 3 weeks before to injections with either oil or tamoxifen (n = 5 and 9 for oil- and tamoxifen-treated mice, respectively). (H) Ex vivo contractile response of mesenteric arteries from oil- and tamoxifen-injected Myh11-Rac1flox/flox mice to a single dose of AngII (1 × 10⁻⁷) (n = 5 and 11 for oil- and tamoxifen-treated mice, respectively). (I) Relaxation response to the indicated concentrations of acetylcholine of mesenteric arteries from 2-month-old Myh11-Rac1flox/flox mice that were subjected 3 weeks before to injections with either oil or tamoxifen. ***, P ≤ 0.001 for the fit of the concentration-response curves to those of control mesenteric arteries (n = 5 and 9 for oil-treated tamoxifen-treated mice, respectively). Error bars represent the SEM.
FIG 4
FIG 4
Vav2-Rac1 route is critical for the NO-mediated inhibition of RhoA-dependent contractile routes in vSMCs. (A) Scheme of signaling routes of vSMCs involved in vasoconstriction (red colors) and vasodilatation (blue colors) responses. GPCR, G protein-coupled receptor; PLCβ, phospholipase β; MLCK, MLC kinase; GEF, GDP/GTP exchange factor; MLCP, MLC phosphatase; sGC, soluble guanylate cyclase; PrkG1, protein kinase G1; PTK, protein tyrosine kinase; Pak, p21-associated kinase; PDE5, phosphodiesterase type 5. Further details are found in the text. (B) cGMP production by Myh11-Rac1flox/flox vSMC cells pretreated with the indicated chemicals and subsequently stimulated with SNP. EtOH, ethanol; Zap, Zaprinast. *, P ≤ 0.05 relative to EtOH-treated cells (which express endogenous Rac1) (n = 3). (C) Amount of GTP-RhoA present in Myh11-Rac1flox/flox vSMC cells that were pretreated with 4OHT and stimulated with SNP as indicated. When 4OHT was not added, cells were pretreated with ethanol as described above. *, P ≤ 0.05 relative to nonstimulated, EtOH-treated cells or the indicated experimental pair (in brackets) (n = 4). (D, upper) Representative immunoblot showing the amount of MLC phosphorylation in primary vSMCs from the indicated mice and culture conditions. (Lower) The amount of tubulin α was used as a loading control. Similar results were obtained in two additional independent experiments. (E) cGMP production by SNP-stimulated vSMC cells obtained from WT and C-OncoVav2 mice. When indicated, cells were pretreated with Zaprinast. *, P ≤ 0.05 relative to SNP-stimulated WT cells (n = 3). (F and G) Mean arterial pressure present in Myh11-Rac1flox/flox (F) and Vav family knockout (G) mice subjected to the indicated treatments. Sildenafil was added in the drinking water for 1 week in each case before blood pressure evaluation. **, P ≤ 0.01 compared to control mice or the indicated experimental pairs (in brackets) (n = 4 to 6). (H and I) Mean arterial pressure present in control (H and I), tamoxifen-treated Myh11-Rac1flox/flox (H), and C-OncoVav2 (I) mice that were either untreated (−) or treated (+L-NAME) with L-NAME for 1 week. P ≤ 0.01 (**) and P ≤ 0.001 (***) compared to either the appropriate control mice or the indicated experimental pairs (in brackets) (n = 4). N.S., not statistically significant. (J and K) Mean arterial pressure present in control (J and K), tamoxifen-treated Myh11-Rac1flox/flox (J), and C-OncoVav2 (K) mice upon the systemic infusion of AngII for 2 weeks. P ≤ 0.05 (*), P ≤ 0.01 (**), and P ≤ 0.001 (***) compared to either the appropriate control mice or the indicated experimental pairs (in brackets) (n = 4). Error bars represent the SEM.
FIG 5
FIG 5
Rac1, but not Vav2, is important for vSMC-mediated neointima formation. (A and B) Representative images (A) (scale bar, 100 μm) and quantification (B) of neointima formation in Myh11-Rac1flox/flox mice 3 weeks after performing the tamoxifen-dependent recombination step. *, P ≤ 0.001 relative to oil-injected mice in the same distance interval (n = 4). (C and D) Representative images (C) (scale bar, 100 μm) and quantification (D) of neointima formation in mice of the indicated genotypes (n = 4). Error bars represent the SEM. (E and F) Representative images (E) (scale bar, 10 μm) and quantification (F) of the migration of primary Myh11-Rac1flox/flox (treated as indicated on the left, top two rows), Vav2+/+ (WT; third row), and Vav2−/− (bottom row) vSMCs. In panel E, the experimental time points upon performing the wound are indicated at the top. The green fluorescence is from a fluorochrome incorporated into cells prior to the wound-healing experiment (see Materials and Methods). *, P ≤ 0.001 relative to the appropriate control cell culture (n = 3). (G) Platelet-derived growth factor-induced proliferation of serum-starved vSMCs of the indicated genotypes. For color codes, see the inset in panel F. *, P ≤ 0.001 relative to the appropriate control cell culture (n = 3). (H) Schematic representation of Rac1-dependent physiological (green color) and pathological (red colors) responses triggered by vSMCs. Upstream exchange factors (GEF) are indicated at the top.
FIG 6
FIG 6
vSMC signaling dysfunctions require cross talk with downstream vasopressor mechanisms for hypertension development. (A to E) Evolution of the amount of plasma choline (A), serotonin (B), AngII (C), noradrenaline (D), and adrenaline (E) in Myh11-Rac1flox/flox mice upon the final injections with either oil or tamoxifen. This time point was considered 0. The periods associated with hypertension conditions (see the legend to Fig. 2D) are indicated as shaded areas in all panels. P ≤ 0.05 (*) and P ≤ 0.001 (***) compared to oil-injected mice (n = 4). (F) Evolution of the heart rates in the same animals and experimental conditions. Periods of hypertension are indicated. P ≤ 0.05 (*) and P ≤ 0.01 (**) compared to oil-injected mice (n = 4). (G) Plasma glucose concentration upon glucose injection in mice 2 (left) and 3 (right) months after final injections with either oil or tamoxifen (n = 4 and 5 for oil- and tamoxifen-treated mice, respectively). (H) Representative images of hematoxylin-eosin-stained sections from the indicated tissues (left) derived from 4-month-old Myh11-Rac1flox/flox mice 3 months after either the oil or tamoxifen injections (top). Scale bars, 100 μm. No signs of steatosis (top) or hypertrophy of white (middle) or brown (bottom) adipocytes are seen (n = 4 and 5 for oil- and tamoxifen-treated mice, respectively). (I) Abundance of the indicated mRNAs typically associated with hepatic steatosis in livers obtained from 4-month-old mice treated as described for panel G (n = 4 and 5 for oil- and tamoxifen-treated mice, respectively). Error bars represent the SEM.
FIG 7
FIG 7
Renin-angiotensin II and sympathetic systems are required to maintain the hypertension of Myh11-Rac1flox/flox mice. (A) Summary of the evolution of indicated physiological parameters and regulatory molecules (left) in Myh11-Rac1flox/flox mice upon the tamoxifen-induced recombination step in the Rac1 locus (data are derived from those shown in Fig. 6). Upregulated (red boxes on basal lane) and downregulated (blue boxes underneath basal lane) responses are indicated. The time after the recombination step is indicated at the top. Effects induced by the indicated drug treatments on either tamoxifen-treated Myh11-Rac1flox/flox (Capt column) or wild-type (AngII, AngII+ARI, and Atr columns) mice are also shown (see the box on the right for other symbols used in this panel). Capt, captopril; ARI, adrenergic receptor inhibitors; Atr, atropine; N.D., not determined. (B) Evolution of mean arterial pressure of tamoxifen-treated Myh11-Rac1flox/flox mice upon the indicated drug treatments. A shaded area indicates the time of administration of each drug. As a control, we included the mean arterial pressure of control, oil-injected Myh11-Rac1flox/flox mice. P ≤ 0.05 (*), P ≤ 0.01 (**), and P ≤ 0.001 (***) relative to oil-injected mice at the indicated experimental time points (n = 4). (C, left) Mean arterial pressure of Myh11-Rac1flox/flox mice that, 4 weeks after the injections with tamoxifen, were treated with the indicated drugs for 1 week. (Right) Mean arterial pressure of Myh11-Rac1flox/flox mice treated with the indicated treatments before and after being injected with either oil or tamoxifen. Recordings were done 1 week after the indicated injections. In both cases, we include for comparison the arterial pressure values of control mice simply injected with oil. Sild, sildenafil; Prop, propranolol. **, P ≤ 0.01 relative to oil-injected mice (n = 4). Error bars represent the SEM.

References

    1. Loirand G, Sauzeau V, Pacaud P. 2013. Small G proteins in the cardiovascular system: physiological and pathological aspects. Physiol. Rev. 93:1659–1720. 10.1152/physrev.00021.2012. - DOI - PubMed
    1. Gong L, Pitari GM, Schulz S, Waldman SA. 2004. Nitric oxide signaling: systems integration of oxygen balance in defense of cell integrity. Curr. Opin. Hematol. 11:7–14. 10.1097/00062752-200401000-00003. - DOI - PubMed
    1. Hofmann F, Feil R, Kleppisch T, Schlossmann J. 2006. Function of cGMP-dependent protein kinases as revealed by gene deletion. Physiol. Rev. 86:1–23. 10.1152/physrev.00015.2005. - DOI - PubMed
    1. Sauzeau V, Le Jeune H, Cario-Toumaniantz C, Smolenski A, Lohmann SM, Bertoglio J, Chardin P, Pacaud P, Loirand G. 2000. Cyclic GMP-dependent protein kinase signaling pathway inhibits RhoA-induced Ca2+ sensitization of contraction in vascular smooth muscle. J. Biol. Chem. 275:21722–21729. 10.1074/jbc.M000753200. - DOI - PubMed
    1. Omori K, Kotera J. 2007. Overview of PDEs and their regulation. Circ. Res. 100:309–327. 10.1161/01.RES.0000256354.95791.f1. - DOI - PubMed

Publication types

MeSH terms