. 2014 Oct 21;111(42):E4494-503.
doi: 10.1073/pnas.1406107111. Epub 2014 Oct 6.

LEOPARD syndrome-associated SHP2 mutation confers leanness and protection from diet-induced obesity

Affiliations

LEOPARD syndrome-associated SHP2 mutation confers leanness and protection from diet-induced obesity

Mylène Tajan et al. Proc Natl Acad Sci U S A. .

Abstract

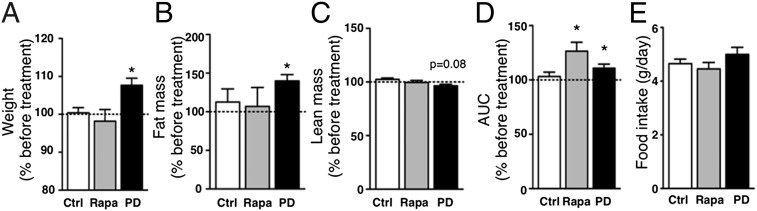
LEOPARD syndrome (multiple Lentigines, Electrocardiographic conduction abnormalities, Ocular hypertelorism, Pulmonary stenosis, Abnormal genitalia, Retardation of growth, sensorineural Deafness; LS), also called Noonan syndrome with multiple lentigines (NSML), is a rare autosomal dominant disorder associating various developmental defects, notably cardiopathies, dysmorphism, and short stature. It is mainly caused by mutations of the PTPN11 gene that catalytically inactivate the tyrosine phosphatase SHP2 (Src-homology 2 domain-containing phosphatase 2). Besides its pleiotropic roles during development, SHP2 plays key functions in energetic metabolism regulation. However, the metabolic outcomes of LS mutations have never been examined. Therefore, we performed an extensive metabolic exploration of an original LS mouse model, expressing the T468M mutation of SHP2, frequently borne by LS patients. Our results reveal that, besides expected symptoms, LS animals display a strong reduction of adiposity and resistance to diet-induced obesity, associated with overall better metabolic profile. We provide evidence that LS mutant expression impairs adipogenesis, triggers energy expenditure, and enhances insulin signaling, three features that can contribute to the lean phenotype of LS mice. Interestingly, chronic treatment of LS mice with low doses of MEK inhibitor, but not rapamycin, resulted in weight and adiposity gains. Importantly, preliminary data in a French cohort of LS patients suggests that most of them have lower-than-average body mass index, associated, for tested patients, with reduced adiposity. Altogether, these findings unravel previously unidentified characteristics for LS, which could represent a metabolic benefit for patients, but may also participate to the development or worsening of some traits of the disease. Beyond LS, they also highlight a protective role of SHP2 global LS-mimicking modulation toward the development of obesity and associated disorders.

Keywords: adipose tissue; energy metabolism; ras/MAPK; rasopathies.


Conflict of interest statement

The authors declare no conflict of interest.

Figures

Fig. 1.
Fig. 1.
LS mice display reduced body mass and adiposity. (A) Schematic representation of the homologous recombination strategy. (B) SHP2 was immunoprecipitated from heart and liver extracts of WT and LS mice (3–4 animals per group), and then a phosphatase assay was conducted by using phospho-Src peptide as a substrate. A control without antibody was also performed (-Ab) (**P < 0.01, unpaired two-tailed Student t test). (Lower) Quality and specificity of immunoprecipitations were verified by Western blot. (CE) WT (n = 8) and LS (n = 6) animals were fed a normal diet. At indicated ages, they were weighted (C) or placed in an EchoMRI apparatus to determine fat mass (D) (*P < 0.05; **P < 0.01, ***P < 0.001, two-way ANOVA plus Bonferroni post hoc test). At 30 wk of age, animals were euthanized, and then their fat pads were weighted (BAT, brown adipose tissue; Epi, epididymal; PR, perirenal; SC, s.c.) (**P < 0.01, ***P < 0.001, unpaired two-tailed Student t test) (E).
Fig. 2.
Fig. 2.
Impaired adipocyte differentiation potential of LS-derived SVF cells. (A) Adipocytes from epididymal adipose tissue of 30-wk-old WT (n = 8) and LS (n = 6) mice were isolated and their size was determined by using a Multisizer Coulter apparatus. (A Inset) Mean adipocyte diameter was calculated. Individual value and mean are represented (*P < 0.05; **P < 0.01, unpaired two-tailed Student t test). (BD) Six- to 8-wk-old WT and LS mice were euthanized (10 mice per group, n = 3), then their adipose tissues were withdrawn, SVF cells were purified, seeded into culture, and incubated in adipocyte differentiation medium. Representative photographs were taken at indicated times for epididymal adipose tissue-derived SVF cells (B). At indicated times, SVF cells derived from epididymal (C) or s.c. (D) adipose tissues were collected, then their RNAs were purified and expression of the indicated genes was determined by real-time PCR (*P < 0.05, Mann–Whitney nonparametric test).
Fig. 3.
Fig. 3.
Increased lipolysis in adipocytes from LS mice. Adipocytes were isolated from epididymal adipose tissue of 30-wk-old WT (n = 8) and LS (n = 6) mice. (A) Adipocyte RNAs were extracted, and then expression of indicated genes was determined by real-time PCR (*P < 0.05; ***P < 0.001, unpaired two-tailed Student t test). (B) Adipocyte aliquots from epididymal adipose tissue were treated with the indicated doses of isoproterenol (Iso), and released glycerol was quantified (*P < 0.05; **P < 0.01, two-way ANOVA plus Bonferroni post hoc test).
Fig. 4.
Fig. 4.
Improved carbohydrate metabolism in LS mice. (A and B) At indicated ages, 6-h starved WT (n = 8) and LS (n = 6) mice were fed with 3 g/kg glucose. (A) Glycaemia was determined by colorimetry at indicated times (*P < 0.05; **P < 0.01, two-way ANOVA plus Bonferroni post hoc test). (B) Insulin levels were determined by ELISA before (−15 min) and after (+15 min) glucose load (*P < 0.05; **P < 0.01; ***P < 0.001, unpaired two-tailed Student t test). (C) Twenty-five–wk–old animals were injected i.p with insulin, then glycaemia was determined by using a glucometer (*P < 0.05; **P < 0.01, two-way ANOVA plus Bonferroni post hoc test). (D) Isolated adipocytes from 30-wk-old WT (n = 6) and LS (n = 6) mice were incubated with 14C 2-deoxyglucose (C14 2-DG) and stimulated or not with the indicated doses of insulin, then 14C 2-DG uptake was determined (*P < 0.05; ***P < 0.001, two-way ANOVA plus Bonferroni post hoc test). (E) Sixteen-week-old animals were i.p. injected with 10 mU/g insulin or PBS (-) as a control, euthanized after 5 or 10 min, then their tissues were withdrawn and protein extracts were analyzed by Western blot. (F and G) MEFs expressing SHP2 WT or its LS derivatives (T468M, Y279C) were stimulated or not with insulin (Ins), then lysed and processed for Western blot (F). Western blots from four independent experiments were quantified with Image Lab (Bio-Rad) (*P < 0.05; ***P < 0.001, paired two-tailed Student t test) (G).
Fig. 5.
Fig. 5.
Chronic MEK inhibition induces weight and adiposity gains in LS mice. LS animals were treated with vehicle (Ctrl, n = 9), PD0325901 (PD, 1 mg⋅kg−1⋅d−1, n = 5), or rapamycin (Rapa, 2 mg⋅kg−1⋅d−1, n = 8) for 1 mo. (A) Animals were weighted before and after treatment, and weight gain was calculated for each animal. (B and C) Before and after treatment, animals were placed in an EchoMRI apparatus, fat (B) and lean (C) masses were determined, and fat gain was calculated. (D) Animals were subjected to an OGTT before and after 2 wk of treatment, the AUC were determined, and AUC variation was calculated. Statistical significance was assessed by using a paired two-tailed Student t test (*P < 0.05). (E) Animals were placed in individual cages and food pellets were weighted over a 2-wk period (nonsignificant, unpaired two-tailed Student t test).
Fig. 6.
Fig. 6.
LS mice are resistant to HFD-induced obesity and seem protected from obesity-associated glucointolerance, insulin resistance and ectopic lipid deposits. (AF) WT (n = 14) and LS (n = 13) animals were fed a HFD, and analyses were performed as in Fig. 1 CE and 4 AC. (G and H) At 30 wk of age, liver (G) and gastrocnemius muscle (H) from WT and LS animals were withdrawn and triglycerides content was determined (*P < 0.05, Mann–Whitney nonparametric test). (I) Representative pictures of H&E liver sections.
Fig. 7.
Fig. 7.
Increased energy expenditure in LS animals. (A) Twenty-week-old WT and LS mice maintained under ND (7 WT, 12 LS) or HFD (7 WT, 6 LS) were placed in individual cages, then food pellets were regularly weighted to determine food intake (nonsignificant, unpaired two-tailed Student t test). (B) WT and LS mice maintained under ND (8 WT, 12 LS) or HFD (9 WT, 7 LS) were placed in individual cages for 3 d, then stool were collected, dried, and energy content was determined by using a bomb calorimeter (nonsignificant, unpaired two-tailed Student t test). (CE) Sixteen- to 18-wk-old WT and LS animals maintained under ND (6 WT, 6 LS) or HFD (7 WT, 6 LS) were placed in individual chambers. After 24 h of acclimatization, they were subjected to indirect calorimetry analysis for 24 h. Activity (C), respiratory quotient (D) and energy expenditure (E) were determined (*P < 0.05; ***P < 0.001, two-way ANOVA with repeated measures). (F–I) Adipose tissues, liver, and muscle samples from 30-wk-old WT and LS mice (8 WT, 8 LS) were processed for real-time PCR analysis to determine expression of the indicated genes (F), for Western blot analysis to assess expression of respiratory chain complexes I to V (G), for determination of mitochondrial DNA content (H) and for cytochrome C activity from tissues homogenates (I) (*P < 0.05; **P < 0.01, unpaired two-tailed Student t test).
Fig. 8.
Fig. 8.
Most LS patients display lower-than-average BMI. (A) BMI z score of female and male LS patients were plotted against age. (B) BMI z score of LS patients were plotted against PTPN11 mutations.

References

    1. Tartaglia M, Gelb BD, Zenker M. Noonan syndrome and clinically related disorders. Best Pract Res Clin Endocrinol Metab. 2011;25(1):161–179. - PMC - PubMed
    1. Keren B, et al. French Collaborative Noonan Study Group PTPN11 mutations in patients with LEOPARD syndrome: A French multicentric experience. J Med Genet. 2004;41(11):e117. - PMC - PubMed
    1. Grossmann KS, Rosário M, Birchmeier C, Birchmeier W. The tyrosine phosphatase Shp2 in development and cancer. Adv Cancer Res. 2010;106:53–89. - PubMed
    1. Zhang SQ, et al. Receptor-specific regulation of phosphatidylinositol 3′-kinase activation by the protein tyrosine phosphatase Shp2. Mol Cell Biol. 2002;22(12):4062–4072. - PMC - PubMed
    1. Zhang SQ, et al. Shp2 regulates SRC family kinase activity and Ras/Erk activation by controlling Csk recruitment. Mol Cell. 2004;13(3):341–355. - PubMed

Publication types

MeSH terms

Substances

LinkOut - more resources