Review
. 2014 Sep 21;13(Suppl 2):67-82.
doi: 10.4137/CIN.S13779. eCollection 2014.

Review of current methods, applications, and data management for the bioinformatics analysis of whole exome sequencing

Affiliations
Review

Review of current methods, applications, and data management for the bioinformatics analysis of whole exome sequencing

Riyue Bao et al. Cancer Inform. .

Abstract

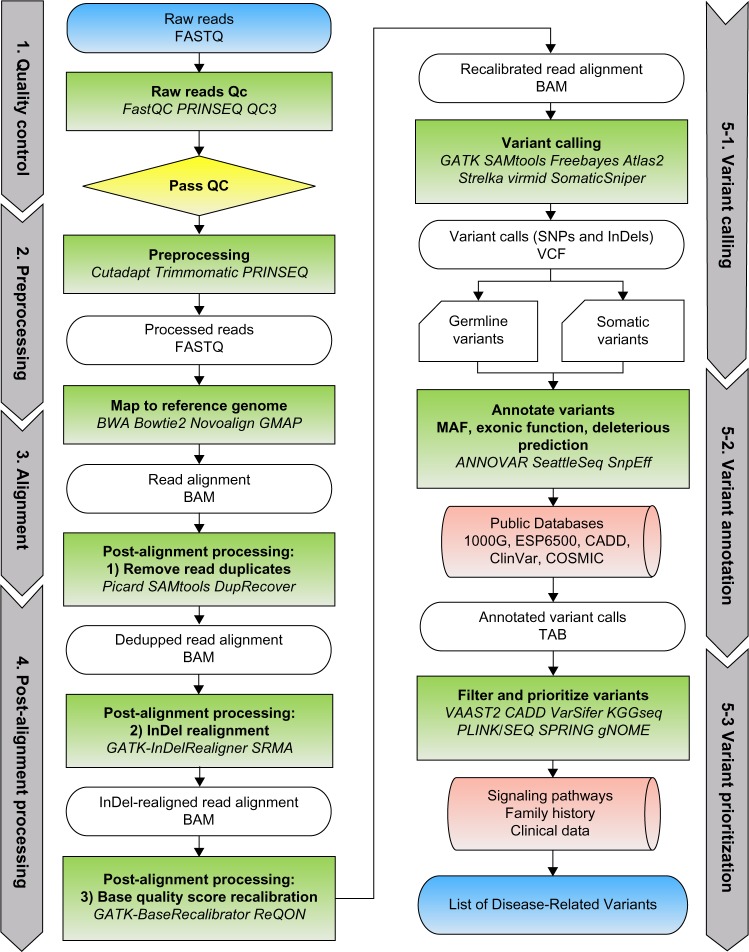
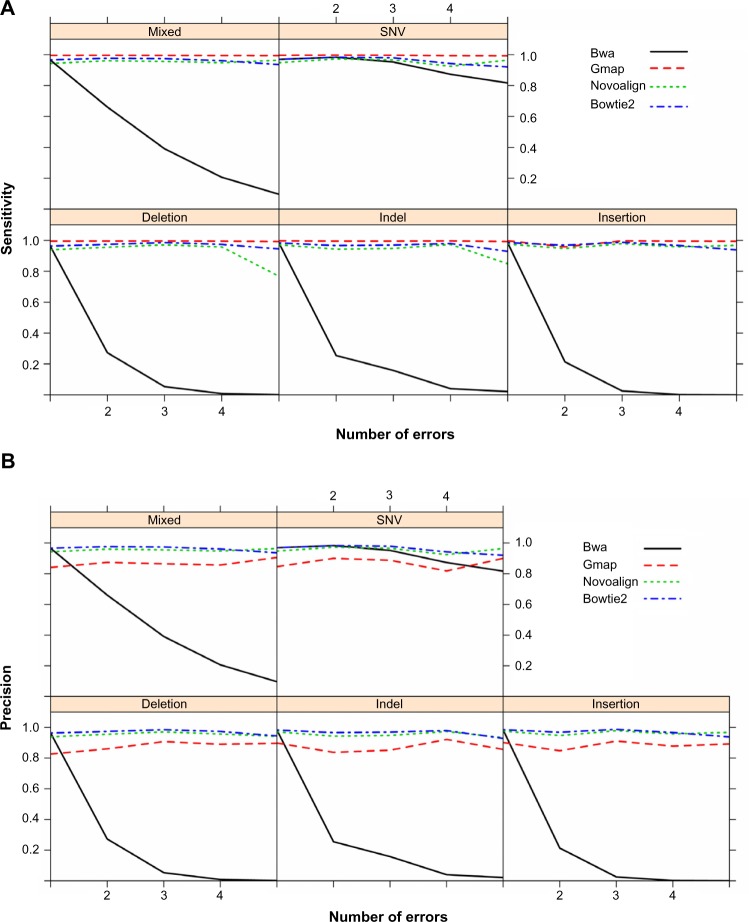
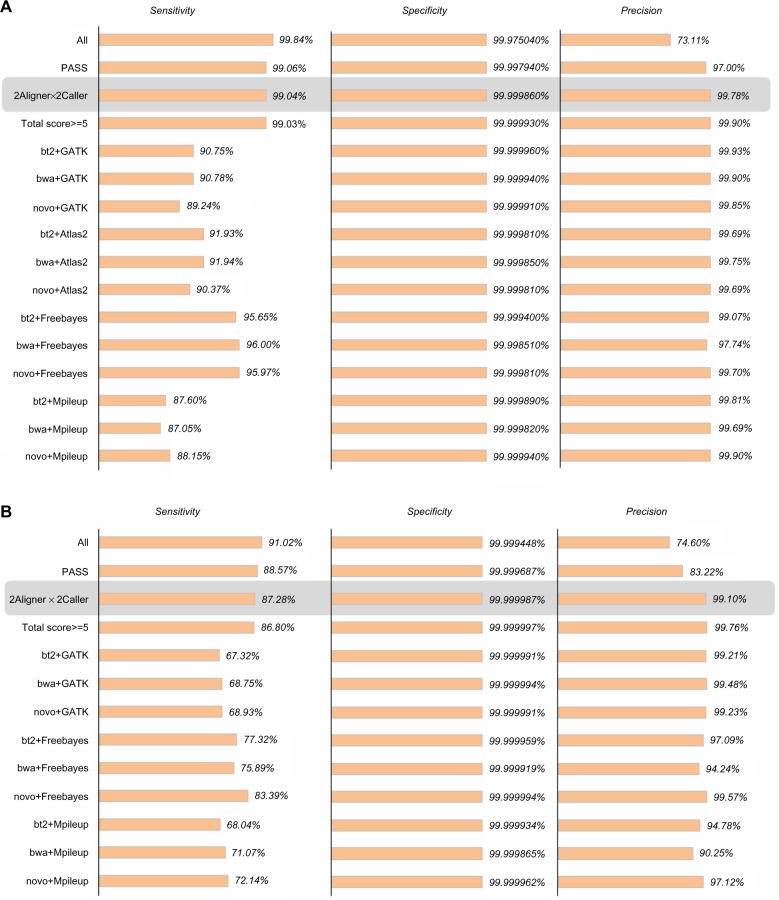
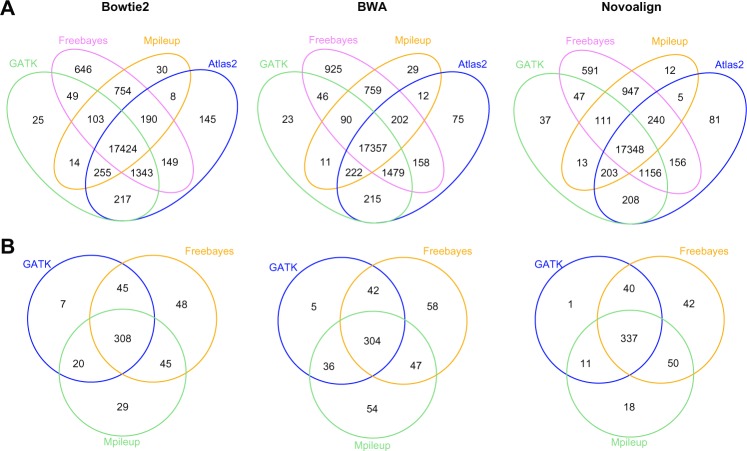
The advent of next-generation sequencing technologies has greatly promoted advances in the study of human diseases at the genomic, transcriptomic, and epigenetic levels. Exome sequencing, where the coding region of the genome is captured and sequenced at a deep level, has proven to be a cost-effective method to detect disease-causing variants and discover gene targets. In this review, we outline the general framework of whole exome sequence data analysis. We focus on established bioinformatics tools and applications that support five analytical steps: raw data quality assessment, pre-processing, alignment, post-processing, and variant analysis (detection, annotation, and prioritization). We evaluate the performance of open-source alignment programs and variant calling tools using simulated and benchmark datasets, and highlight the challenges posed by the lack of concordance among variant detection tools. Based on these results, we recommend adopting multiple tools and resources to reduce false positives and increase the sensitivity of variant calling. In addition, we briefly discuss the current status and solutions for big data management, analysis, and summarization in the field of bioinformatics.

Keywords: InDel; SNV; big data; next generation sequencing; sequence alignment; variant analysis; whole exome sequencing.


Figures

Figure 1
Figure 1
A general framework of WES data analysis. Five major steps are shown: raw reads QC, preprocessing, alignment, post-processing, and variant analysis (variant calling, annotation, and prioritization). Notes: FASTQ, BAM, variant call format (VCF), and TAB (tab-delimited) refer to the standard file format of raw data, alignment, variant calls, and annotated variants, respectively. A selection of tools supporting each analysis step is shown in italic.
Figure 2
Figure 2
Comparison of alignment tools in terms of sensitivity (A) and precision (B) with 1–5 bp genomic variations per simulated read. Five sets of alignment are shown with introduction of errors categorized by types of errors (deletions only, insertions only, insertions and deletions (indels), SNVs, and a mixture of indels and SNVs (mixed)). Notes: Sensitivity is represented by the percentage of true alignments out of all simulated reads (5 million in total), and precision is the ratio of the number of true alignments to the number of aligned reads.
Figure 3
Figure 3
Evaluation results of variant callers with alignment generated by three aligners for SNVs (A) and indels (B). Aligners used for mapping the reads to the genome include Bowtie2 (bt2), BWA, and Novoalign (novo). Notes: SNV callers include GATK UnifiedGenotyper, FreeBayes, SAMtools mpileup, and Atlas2. The first three were also used for calling indels. Gray background highlights the filter recommended for downstream variant analysis (“2Aligner × 2Caller”), which is shown to have better sensitivity than any single algorithm (99.94% for SNVs and 87.28% for indels) and high precision rate (99.78% for SNVs and 99.10% for indels). “Total score ≥5″ represents variants detected in at least 5 out of 12 sets.
Figure 4
Figure 4
Counts of variants detected by four callers with alignment generated by three aligners as shown in Venn diagram of (A) SNVs and (B) indels.

References

    1. Golub TR, Slonim DK, Tamayo P, et al. Molecular classification of cancer: class discovery and class prediction by gene expression monitoring. Science. 1999;286:531–7. - PubMed
    1. Cancer Genome Atlas Research Network. Integrated genomic analyses of ovarian carcinoma. Nature. 2011;474:609–15. - PMC - PubMed
    1. Fertig EJ, Slebos R, Chung CH. Application of genomic and proteomic technologies in biomarker discovery. Am Soc Clin Oncol Educ Book. 2012;32:377–82. - PubMed
    1. Ansari NA, Bao R, Voichita C, Draghici S. Detecting phenotype-specific interactions between biological processes from microarray data and annotations. IEEE/ACM Trans Comput Biol Bioinform. 2012;9:1399–409. - PMC - PubMed
    1. Huang L, Zhao S, Frasor JM, Dai Y. An integrated bioinformatics approach identifies elevated cyclin E2 expression and E2F activity as distinct features of tamoxifen resistant breast tumors. PLoS One. 2011;6:e22274. - PMC - PubMed