. 2014 Oct 7;9(10):e109365.
doi: 10.1371/journal.pone.0109365. eCollection 2014.

Kernel density surface modelling as a means to identify significant concentrations of vulnerable marine ecosystem indicators

Affiliations

Kernel density surface modelling as a means to identify significant concentrations of vulnerable marine ecosystem indicators

Ellen Kenchington et al. PLoS One. .

Erratum in

Abstract

The United Nations General Assembly Resolution 61/105, concerning sustainable fisheries in the marine ecosystem, calls for the protection of vulnerable marine ecosystems (VME) from destructive fishing practices. Subsequently, the Food and Agriculture Organization (FAO) produced guidelines for identification of VME indicator species/taxa to assist in the implementation of the resolution, but recommended the development of case-specific operational definitions for their application. We applied kernel density estimation (KDE) to research vessel trawl survey data from inside the fishing footprint of the Northwest Atlantic Fisheries Organization (NAFO) Regulatory Area in the high seas of the northwest Atlantic to create biomass density surfaces for four VME indicator taxa: large-sized sponges, sea pens, small and large gorgonian corals. These VME indicator taxa were identified previously by NAFO using the fragility, life history characteristics and structural complexity criteria presented by FAO, along with an evaluation of their recovery trajectories. KDE, a non-parametric neighbour-based smoothing function, has been used previously in ecology to identify hotspots, that is, areas of relatively high biomass/abundance. We present a novel approach of examining relative changes in area under polygons created from encircling successive biomass categories on the KDE surface to identify "significant concentrations" of biomass, which we equate to VMEs. This allows identification of the VMEs from the broader distribution of the species in the study area. We provide independent assessments of the VMEs so identified using underwater images, benthic sampling with other gear types (dredges, cores), and/or published species distribution models of probability of occurrence, as available. For each VME indicator taxon we provide a brief review of their ecological function which will be important in future assessments of significant adverse impact on these habitats here and elsewhere.


Conflict of interest statement

Competing Interests: The authors have declared that no competing interests exist.

Figures

Figure 1
Figure 1. Location of the study area in the international waters east of Newfoundland and Labrador, Canada.
Red line indicates the Canadian Exclusive Economic Zone. Heavy black line indicates the 2500 m depth contour. NAFO management divisions are indicated.
Figure 2
Figure 2. Location of trawl sets for the research vessel surveys in the NAFO Regulatory Area (Divs. 3LMNO) used for analyses (Table 1).
Left panels: Sponges; Right Panels: Corals.
Figure 3
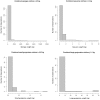
Figure 3. Catch weight distribution for all non-zero data of sponges (upper left), sea pens (upper right), small gorgonian corals (lower left) and large gorgonian corals (lower right).
Figure 4
Figure 4. Catch weight (kg) of each VME indicator taxon in relation of trawl length (nmi) for each of the surveys indicated in Table 1 (Canadian surveys with Campelen gear, Spanish/EU surveys with Campelen gear and Spanish/EU surveys with Lofoten gear).
The dashed line indicates the catch value above which the distributions are not significantly different (Table 2). Note that the y axis is in logarithmic scale. A) Sponges. B) Sea pens. C) Small gorgonian corals. D) Large gorgonian corals.
Figure 5
Figure 5
Left panel: Kernel density distribution of sponges in the NAFO Regulatory area with the 75 kg density polygons defining significant concentrations determined from aerial expansion thresholds superimposed in red. The green areas represent low sponge densities while the red areas indicate high sponge densities. Right panel: The location of catches greater than 75 kg (red circle) and smaller sponge catches (open circles) within the 75 kg density polygons defining the sponge ground VMEs.
Figure 6
Figure 6. Histograms of the area occupied by successive weight thresholds of VME Indicator taxa.
The numbers of additional point observations (over the preceding higher weight threshold) used to create each polygon are indicated above the each bar. A) Sponges. B) Sea pens. C) Small gorgonian corals. D) Large gorgonian corals.
Figure 7
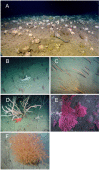
Figure 7. Underwater images were taken from the locations of large research vessel trawl catches of (A) Geodid-dominated sponge grounds from the northeast Flemish Cap in the NAFO Regulatory area (NRA), (B) sea pen fields in the Laurentian Channel south of the NRA dominated by species of Pennatula, a smaller flesher sea pen, (C) sea pen fields in the Laurentian Channel south of the NRA dominated by the taller whip-like species Halipteris finmarchica, (D) large gorgonian corals in the Laurentian Channel south of the NRA (Keratoisis sp.), (E) large gorgonian corals from the southern wall of Flemish Pass in the NRA (Paragorgia sp.), (F) Acanella arbuscula from the Gully Marine Protected Area on the Scotian Shelf showing its dense branching architecture.
Figure 8
Figure 8
Left panel: Kernel density distribution of sea pens in the NAFO Regulatory area with the 1.4 kg density polygons defining the sea pen field VMEs superimposed in red. The green areas represent low sea pen densities while the red areas indicate high sea pen densities. Right panel: The location of catches greater than 1.4 kg (red circle) and smaller sea pen catches (open circles) within the 1.4 kg density polygons defining the sea pen field VMEs.
Figure 9
Figure 9
Left panel: Kernel density distribution of small gorgonian corals (primarily Acanella arbuscula) on the Tail of Grand Bank in the NAFO Regulatory area with the 0.15 kg density polygons superimposed in red. Arrows point to catches that appear to be isolated and require more data to establish their spatial extent. Right panel: The location of catches greater than 0.15 kg (red circle) and smaller small gorgonian coral catches (open circles) within the 0.15 kg density polygons defining the small gorgonian coral VMEs.
Figure 10
Figure 10
Left panel: Kernel density distribution of large gorgonian corals in the NAFO Regulatory area with the 0.6 kg density polygons defining significant concentrations superimposed in red. Right panel: The location of catches greater than 0.6 kg (red circle) and smaller coral catches (open circles) within the 0.6 kg density polygons defining the large gorgonian coral VMEs.

References

    1. FAO (2009) International Guidelines for the Management of Deep-sea Fisheries in the High Seas. FAO, Rome. 73p.
    1. Fuller SD, Murillo Perez FJ, Wareham V, Kenchington E (2008) Vulnerable Marine Ecosystems Dominated by Deep-Water Corals and Sponges in the NAFO Convention Area. Ser No N5524. NAFO SCR Doc 08/22, 24pp.
    1. NAFO (2008) Scientific Council Meeting 22–30 October 2008. Ser No N5594. NAFO SCS Doc 08/26, 32p.
    1. Murillo FJ, Kenchington E, Sacau M, Piper DJW, Wareham V, et al... (2011) New VME indicator species (excluding corals and sponges) and some potential VME elements of the NAFO Regulatory Area. Ser No N6003. NAFO SCR Doc 11/73, 20 p.
    1. NAFO (2012) Scientific Council Meeting –2012. Ser No N6072. NAFO SCS Doc 12/19, 215p.

Publication types

LinkOut - more resources