. 2014 Oct 15;98(7):697-705.
doi: 10.1097/TP.0000000000000370.

Gut microbial community structure and complications after kidney transplantation: a pilot study

Affiliations

Gut microbial community structure and complications after kidney transplantation: a pilot study

John R Lee et al. Transplantation. .

Abstract

Background: The gut microbiome plays a role in the regulation of the immune system.

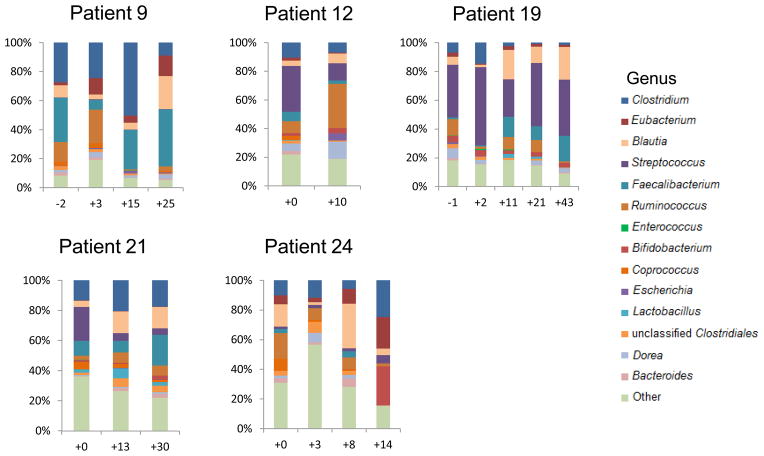
Methods: We prospectively enrolled 26 kidney transplant recipients and collected serial fecal specimens (N=85) during the first three months of transplantation. We characterized bacterial composition by polymerase chain reaction amplification of the 16S rRNA V4-V5 variable region and deep sequencing using the Illumina MiSeq platform.

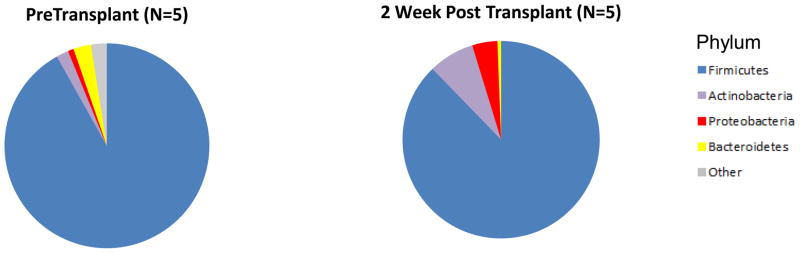
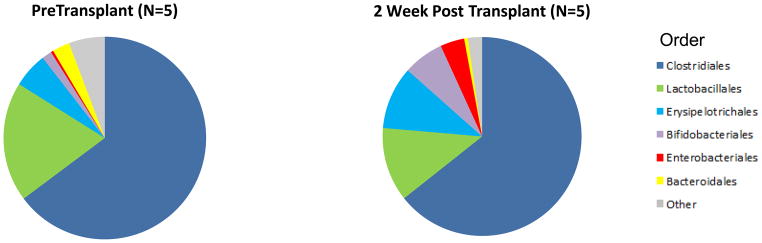
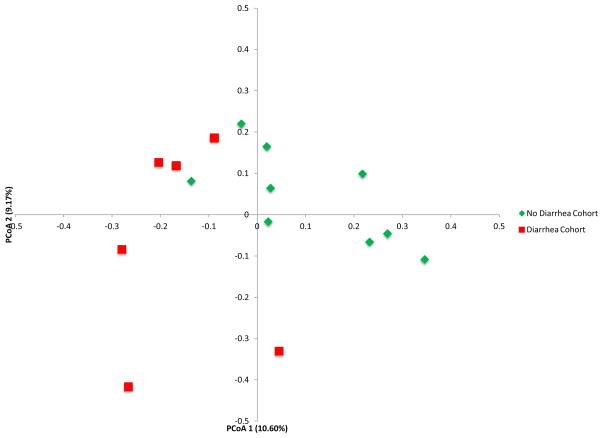
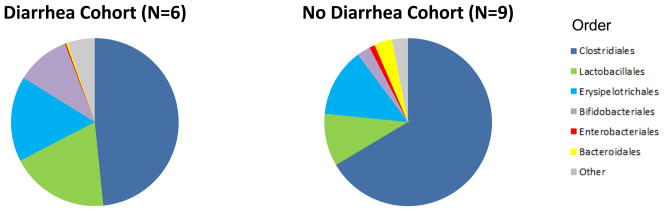
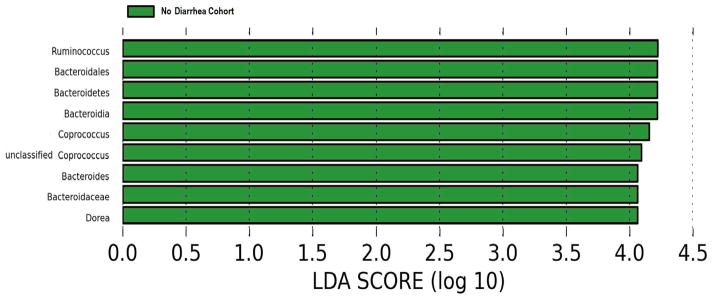
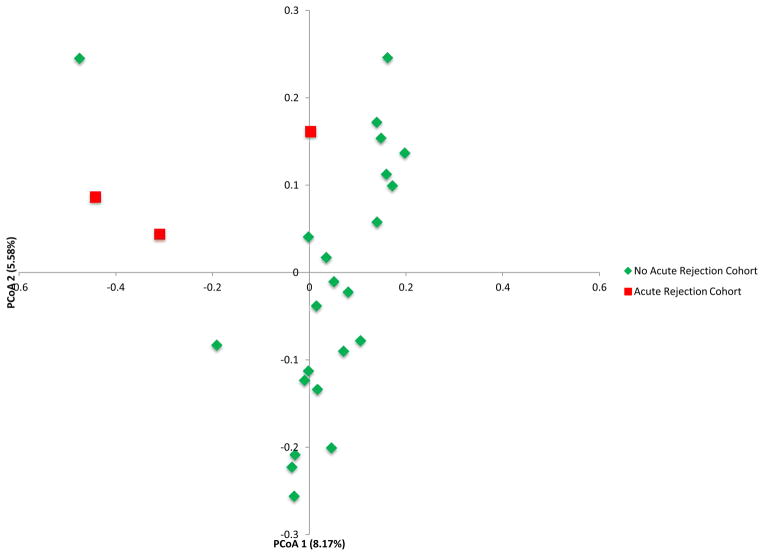
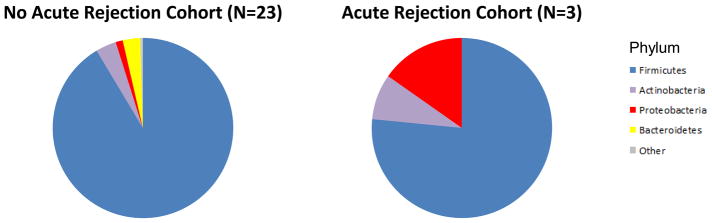
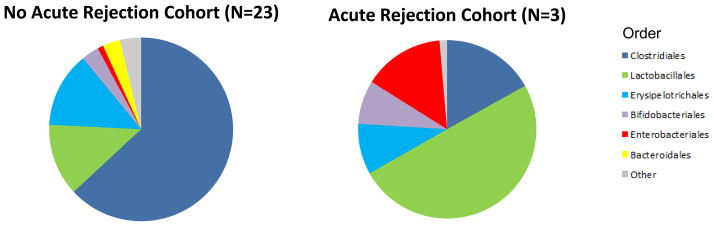
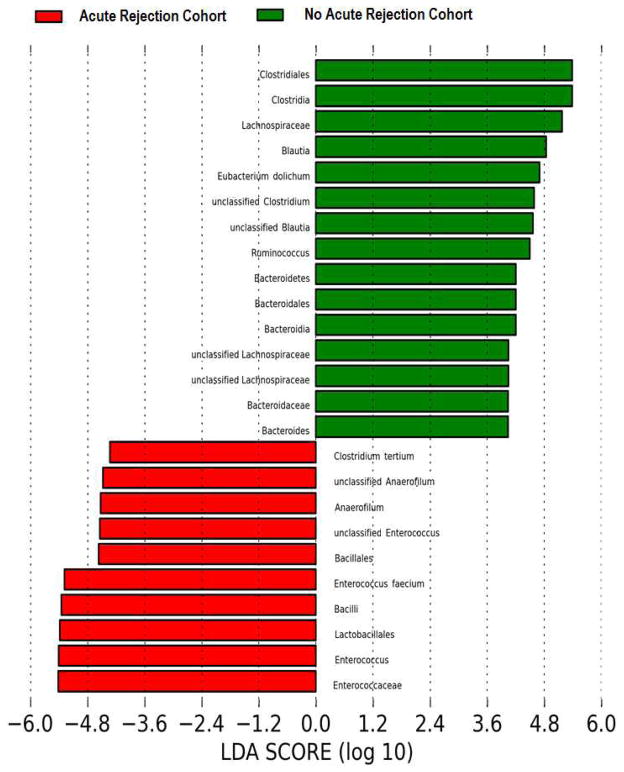
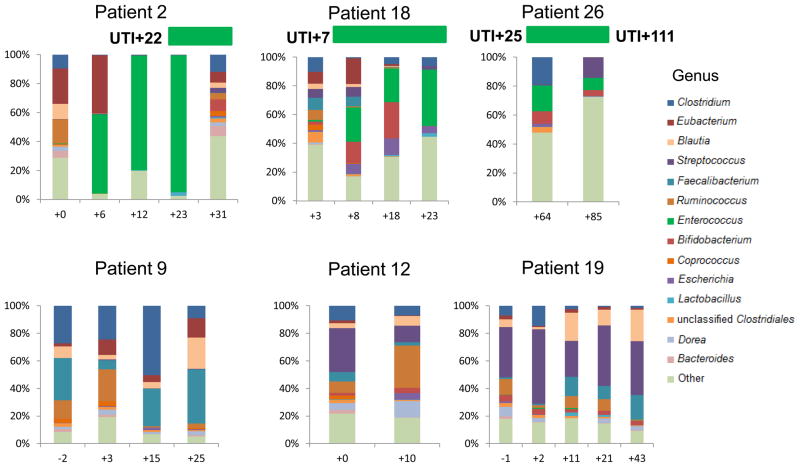
Results: An increase in the relative abundance of Proteobacteria was observed in the posttransplantation specimens compared to pretransplantation specimens (P=0.04, Wilcoxon signed-rank test). In patients with posttransplant diarrhea, the mean(±standard deviation [SD]) Shannon diversity index was lower in those with diarrhea (N=6) than those without diarrhea (N=9) (2.5±0.3 vs. 3.4±0.8; P = 0.02, Wilcoxon rank-sum test). Principal coordinate analysis showed clear separation between the two groups, and linear discriminant analysis effect size (LEfSe) method revealed that Bacteroides, Ruminococcus, Coprococcus, and Dorea were significantly lower in the patients with diarrhea. Principal coordinate analysis also showed clear separation between the acute rejection (AR) group (N=3) and the no AR group (N=23) and the LEfSe method revealed significant differences between the two groups. Fecal abundance of Enterococcus was associated with Enterococcus urinary tract infection (UTI). The median Enterococcus fecal abundance was 24% (range, 8%-95%) in the three patients with Enterococcus UTI compared to 0% in the 23 patients without Enterococcus UTI (interquartile range, 0.00%-0.08%) (P=0.005, Wilcoxon rank-sum test).

Conclusion: Our pilot study identified significant alterations in the gut microbiota after kidney transplantation. Moreover, distinct microbiota structures were observed in allograft recipients with posttransplant diarrhea, AR, and Enterococcus UTI.


Conflict of interest statement

Conflicts of Interest:

The authors declare no conflict of interest.

Figures

Figure 1
Figure 1. Alterations in the Gut Microbiota Following Kidney Transplantation
Each of the 5 kidney transplant recipients provided a fecal specimen prior to transplantation and prior to receiving any induction immunosuppression therapy or antibiotic prophylaxis and a second fecal specimen approximately 2 weeks after transplantation. All 5 recipients received similar induction therapy, preoperative antibiotics, and PCP prophylaxis therapy. The 5 sets of bar graphs show the gut microbiota of the 5 kidney transplant recipients at the genus level over time (Panel A). Each bar represents the relative composition of bacteria in the stool sample from each patient. The x-axis indicates the day of specimen collection from the transplantation event as the reference day (Day 0); the y-axis indicates the relative bacterial percentage corresponding to each taxon. Each taxon is labeled by color as defined in the legend. Panels B and C show the differences in gut microbial composition between the pre-transplantation specimens and the 2 week post-transplantation specimens by phylum and order levels, respectively. Each color in the pie chart represents the corresponding taxon group in the legend. At the phylum level, the relative abundance of Proteobacteria (red) was higher in the post-transplantation specimens compared to pre-transplantation specimen in all 5 patients (P=0.04, Wilcoxon signed-rank test). At the order level, the relative abundance of Erysipelotrichales (light blue, P=0.04) and Enterobacteriales (red, P=0.04) were higher in the post-transplantation specimen compared to pre-transplantation specimen in all 5 patients.
Figure 2
Figure 2. Differential Gut Microbial Composition in Patients with or without Post-Transplant Diarrhea
Panel A shows the principal coordinate analyses of the 6 patients with diarrhea and the 9 patients without diarrhea. The first two axes of the principal coordinate analysis are represented with principal coordinate axis 1 on the y-axis (10.60% variability) and principal coordinate axis 2 on the x-axis (9.17% variability). The individual red points represent the 6 fecal specimens from the 6 patients with diarrhea and the individual green points represent the 9 fecal specimens from the 9 patients without diarrhea. Panels B and C represent the differences in gut microbiota between the diarrhea cohort and no diarrhea cohort by phylum and order levels, respectively. Each color in the pie chart represents the corresponding taxon group in the legend. Bacteroidetes and Bacteroidales are represented in yellow and were significantly decreased in the diarrhea cohort (P=0.007, P=0.007, respectively). LEfSe method was performed to determine individual taxons that were significantly associated with the diarrhea cohort (red) and the no diarrhea cohort (green) (Panel D). A cladogram based on the LEfSe method is shown in Panel E and highlights the taxonomic groups in the diarrhea cohort (red) and in the no diarrhea cohort (green).
Figure 3
Figure 3. Differential Gut Microbial Composition in Patients with or without Acute Rejection
Panel A represents the principal coordinate analyses of the individual patients with or without biopsy confirmed acute rejection. The first two axes of the principal coordinate analysis are represented with principal coordinate axis 1 on the y-axis (8.17% variability) and principal coordinate axis 2 on the x-axis (5.58% variability). The individual red points represent the 3 fecal specimens from the 3 patients with biopsy confirmed AR and the individual green points represent the 23 time matched fecal specimens from the 23 patients who did not develop AR. Panels B and C represent the differences in fecal microbiota between the two groups by phylum and order levels, respectively. Each color in the pie chart represents the corresponding taxon in the legend. At the phylum level, Bacteroidetes was lower in the AR cohort than in the no AR cohort (P=0.03). At the order level, Lactobacillales was higher in the AR cohort (P=0.04) and Clostridiales and Bacteroidales was lower in the AR cohort (P=0.01, P=0.03, respectively) when compared to the no AR cohort. LEfSe method was performed to determine individual taxons that were significantly associated in the AR cohort (red) and in the no AR cohort (green) (Panel D). A cladogram based on the LEfSe method is shown on Panel E and highlights the taxonomic groups associated with AR (red) and no AR (green).
Figure 4
Figure 4. Enterococcus Fecal Abundance and Enterococcus Urinary Tract Infections in Allograft Recipients
The 6 sets of bar graphs represent 6 of the 26 kidney transplant recipients studied; patients 2, 18, and 26 developed Enterococcus UTI and patients 9, 12, and 19 are 3 of the 23 patients who did not develop Enterococcus UTI. Each bar represents the relative composition of bacteria in the stool sample from each patient. The x-axis indicates the day of specimen collection from the transplantation event as the day of reference (day 0); the y-axis indicates the relative bacterial percentage corresponding to each taxon. Each taxon is labeled by color as defined in the legend. Enterococcus relative abundance is represented in green and is present in patients 2, 18, and 26 whereas absent in the patients without Enterococcus UTI. The timing/day of the Enterococcus UTI is indicated by the horizontal bar in green above the bar graphs.

Comment in

Similar articles

Cited by

References

    1. Human Microbiome Consortium. Structure, function and diversity of the healthy human microbiome. Nature. 2012;486 (7402):207. - PMC - PubMed
    1. Oh PL, Martinez I, Sun Y, Walter J, Peterson DA, Mercer DF. Characterization of the ileal microbiota in rejecting and nonrejecting recipients of small bowel transplants. Am J Transplant. 2012;12 (3):753. - PubMed
    1. Taur Y, Xavier JB, Lipuma L, et al. Intestinal domination and the risk of bacteremia in patients undergoing allogeneic hematopoietic stem cell transplantation. Clin Infect Dis. 2012;55 (7):905. - PMC - PubMed
    1. Vaziri ND, Wong J, Pahl M, et al. Chronic kidney disease alters intestinal microbial flora. Kidney Int. 2013;83 (2):308. - PubMed
    1. Magurran AE. Biological diversity. Curr Biol. 2005;15 (4):R116. - PubMed

Publication types

MeSH terms

Substances