

doi: 10.1038/srep06539.
The effect of sample storage on the Peroxidation of Leukocytes Index Ratio (PLIR) measure
Affiliations
- PMID: 25290094
- PMCID: PMC5377464
- DOI: 10.1038/srep06539
Item in Clipboard
The effect of sample storage on the Peroxidation of Leukocytes Index Ratio (PLIR) measure
Sci Rep.
.
Abstract
Delays in processing are frequent because of problems associated with transporting the samples to the laboratory. Thus, we aimed to evaluate the effect of sample storage on the Peroxidation of Leukocytes Index Ratio (PLIR). Differences between PLIR values of lymphocytes (PLIR-L), monocytes (PLIR-M) and granulocytes (PLIR-G) were observed in fresh samples. Sample storage affected the evaluation of PLIR. In particular, PLIR-L was lower in stored samples compared to fresh samples. In conclusion, our results suggest that fresh samples are recommended for assessing the PLIR.
Conflict of interest statement
The authors declare no competing financial interests.
Figures
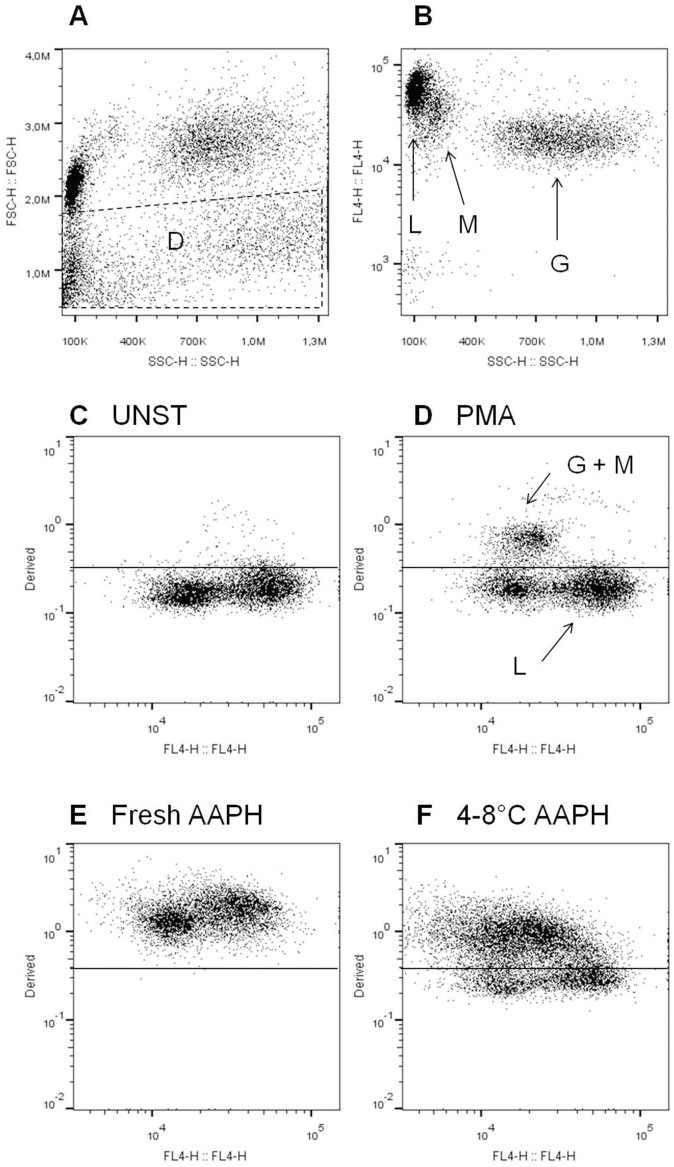
Typical dot plots FSC vs. SSC (A) and FL4 (CD45-APC) vs. SSC (B); L: lymphocytes, M: monocytes, G: granulocytes, D: dead cells and/or debris. Typical dot plots Derived (FL1/FL2) vs. FL4 of cells un-stimulated (UNST) (C) or treated with PMA (1 μg/ml) (D) or AAPH (10 mM) (E and F) for 30 min.
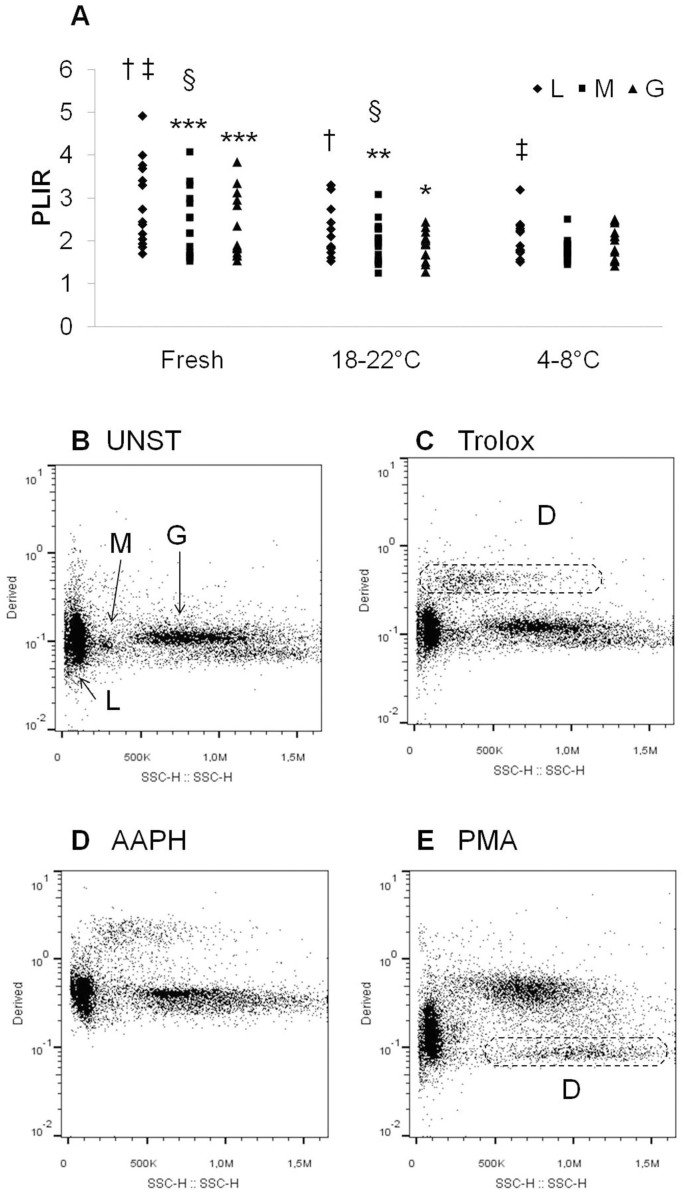
Raw data of PLIR values of lymphocytes (L), monocytes (M) and granulocytes (G), measured in fresh samples or samples stored at 18–22°C or 4–8°C for 24 h (A). Comparisons for factor sample within L: †p < 0.05, ‡p < 0.01; within M: §p < 0.01. Comparisons for factor cell within sample: L versus G or M **p < 0.01, ***p < 0.001. Typical dot plots Derived (FL1/FL2) versus SSC of L, M, and G from samples stored at 4–8°C for 24 h, un-stimulated (UNST) (B) or treated with Trolox (10 μM) (C), AAPH (10 mM) (D) or PMA (1 μg/ml) (E). D: dead cells and/or debris.
Similar articles
-
Relationship between the Peroxidation of Leukocytes Index Ratio and the Improvement of Postprandial Metabolic Stress by a Functional Food.Oxid Med Cell Longev. 2016;2016:5630985. doi: 10.1155/2016/5630985. Epub 2015 Dec 28. Oxid Med Cell Longev. 2016. PMID: 26962396 Free PMC article. Clinical Trial.
-
The Peroxidation of Leukocytes Index Ratio Reveals the Prooxidant Effect of Green Tea Extract.Oxid Med Cell Longev. 2016;2016:9139731. doi: 10.1155/2016/9139731. Epub 2016 Dec 22. Oxid Med Cell Longev. 2016. PMID: 28101300 Free PMC article.
-
A new flow cytometry method to measure oxidative status: the Peroxidation of Leukocytes Index Ratio (PLIR).J Immunol Methods. 2013 Apr 30;390(1-2):113-20. doi: 10.1016/j.jim.2013.02.005. Epub 2013 Feb 20. J Immunol Methods. 2013. PMID: 23454245
-
Stability of canine and feline cerebrospinal fluid samples regarding total cell count and cell populations stored in "TransFix®/EDTA CSF sample storage tubes".BMC Vet Res. 2020 Dec 17;16(1):487. doi: 10.1186/s12917-020-02698-5. BMC Vet Res. 2020. PMID: 33334339 Free PMC article.
-
Flow cytometric detection of receptors for interleukin-6 on bone marrow and peripheral blood cells of humans and rhesus monkeys.Blood. 1993 Apr 15;81(8):2036-43. Blood. 1993. PMID: 8097119
Cited by
-
Relationship between the Peroxidation of Leukocytes Index Ratio and the Improvement of Postprandial Metabolic Stress by a Functional Food.Oxid Med Cell Longev. 2016;2016:5630985. doi: 10.1155/2016/5630985. Epub 2015 Dec 28. Oxid Med Cell Longev. 2016. PMID: 26962396 Free PMC article. Clinical Trial.
-
Measurement and Clinical Significance of Biomarkers of Oxidative Stress in Humans.Oxid Med Cell Longev. 2017;2017:6501046. doi: 10.1155/2017/6501046. Epub 2017 Jun 18. Oxid Med Cell Longev. 2017. PMID: 28698768 Free PMC article. Review.
-
The Peroxidation of Leukocytes Index Ratio Reveals the Prooxidant Effect of Green Tea Extract.Oxid Med Cell Longev. 2016;2016:9139731. doi: 10.1155/2016/9139731. Epub 2016 Dec 22. Oxid Med Cell Longev. 2016. PMID: 28101300 Free PMC article.
References
-
- Knasmuller S. et al. Use of conventional and -omics based methods for health claims of dietary antioxidants: a critical overview. Br. J. Nutr. 99, ES3–ES52 (2008). - PubMed
-
- Ghiselli A., Serafini M., Maiani G., Azzini E. & Ferro-Luzzi A. A fluorescence-based method for measuring total plasma antioxidant capability. Free Radic. Biol. Med. 18, 29–36 (1995). - PubMed
-
- Benzie I. F. F. & Strain J. J. The ferric reducing ability of plasma (FRAP) as a measure of antioxidant power: the FRAP assay. Anal. Biochem. 239, 70–76 (1996). - PubMed
-
- Basiglio C. L. et al. Complement activation and disease: protective effects of hyperbilirubinaemia. Clin. Sci. (Lond). 118, 99–113 (2009). - PubMed
-
- Alvarez-Lario B. & Macarrón-Vicente J. Is there anything good in uric acid? QJM. 104, 1015–1024 (2011). - PubMed
MeSH terms
LinkOut - more resources
Full Text Sources
Other Literature Sources
