

Bacterial ClpB heat-shock protein, an antigen-mimetic of the anorexigenic peptide α-MSH, at the origin of eating disorders
- PMID: 25290265
- PMCID: PMC4350527
- DOI: 10.1038/tp.2014.98
Bacterial ClpB heat-shock protein, an antigen-mimetic of the anorexigenic peptide α-MSH, at the origin of eating disorders
Abstract
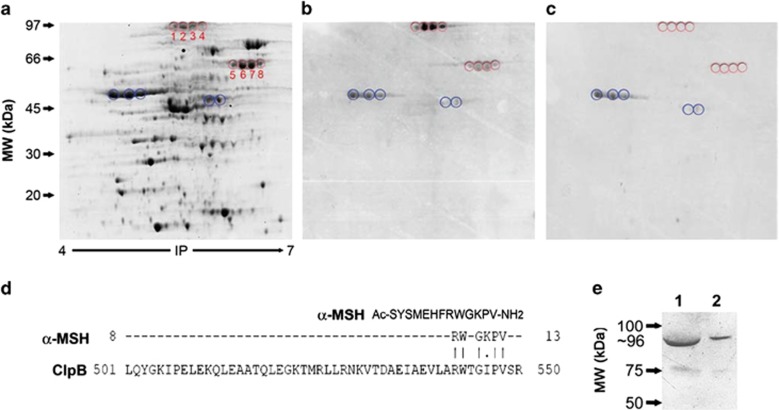
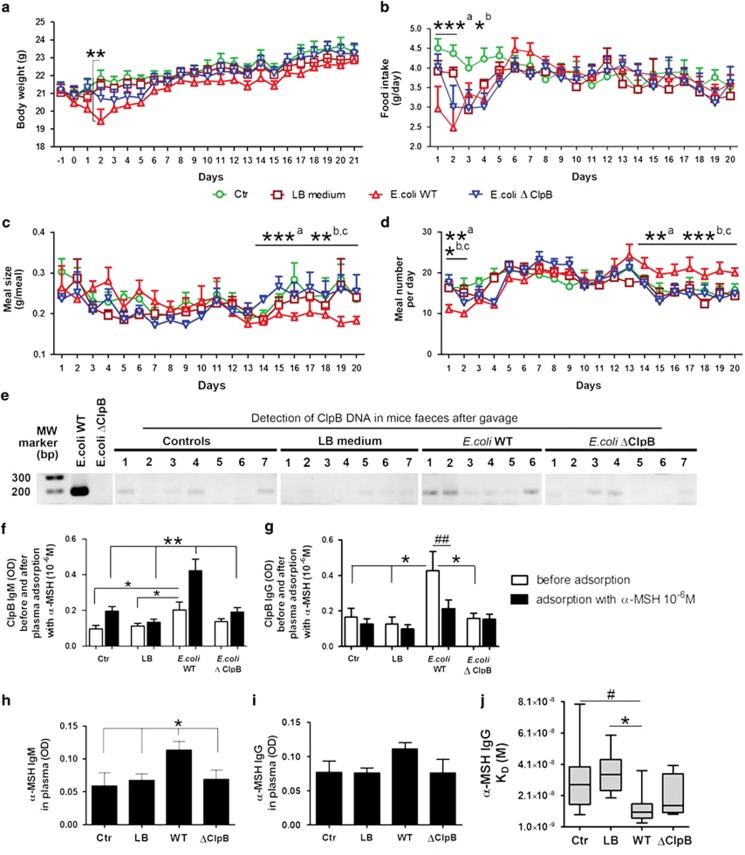
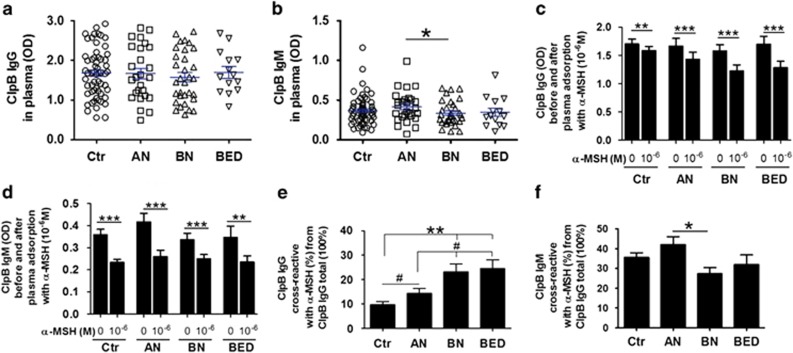
The molecular mechanisms at the origin of eating disorders (EDs), including anorexia nervosa (AN), bulimia and binge-eating disorder (BED), are currently unknown. Previous data indicated that immunoglobulins (Igs) or autoantibodies (auto-Abs) reactive with α-melanocyte-stimulating hormone (α-MSH) are involved in regulation of feeding and emotion; however, the origin of such auto-Abs is unknown. Here, using proteomics, we identified ClpB heat-shock disaggregation chaperone protein of commensal gut bacteria Escherichia coli as a conformational antigen mimetic of α-MSH. We show that ClpB-immunized mice produce anti-ClpB IgG crossreactive with α-MSH, influencing food intake, body weight, anxiety and melanocortin receptor 4 signaling. Furthermore, chronic intragastric delivery of E. coli in mice decreased food intake and stimulated formation of ClpB- and α-MSH-reactive antibodies, while ClpB-deficient E. coli did not affect food intake or antibody levels. Finally, we show that plasma levels of anti-ClpB IgG crossreactive with α-MSH are increased in patients with AN, bulimia and BED, and that the ED Inventory-2 scores in ED patients correlate with anti-ClpB IgG and IgM, which is similar to our previous findings for α-MSH auto-Abs. In conclusion, this work shows that the bacterial ClpB protein, which is present in several commensal and pathogenic microorganisms, can be responsible for the production of auto-Abs crossreactive with α-MSH, associated with altered feeding and emotion in humans with ED. Our data suggest that ClpB-expressing gut microorganisms might be involved in the etiology of EDs.
Figures

Similar articles
-
Elevated plasma concentrations of bacterial ClpB protein in patients with eating disorders.Int J Eat Disord. 2016 Aug;49(8):805-8. doi: 10.1002/eat.22531. Epub 2016 Apr 1. Int J Eat Disord. 2016. PMID: 27038326
-
Sex-related effects of nutritional supplementation of Escherichia coli: relevance to eating disorders.Nutrition. 2015 Mar;31(3):498-507. doi: 10.1016/j.nut.2014.11.003. Epub 2014 Dec 5. Nutrition. 2015. PMID: 25701341
-
Immunoglobulin G modulation of the melanocortin 4 receptor signaling in obesity and eating disorders.Transl Psychiatry. 2019 Feb 12;9(1):87. doi: 10.1038/s41398-019-0422-9. Transl Psychiatry. 2019. PMID: 30755592 Free PMC article.
-
Bacterial Protein Mimetic of Peptide Hormone as a New Class of Protein- based Drugs.Curr Med Chem. 2019;26(3):546-553. doi: 10.2174/0929867324666171005110620. Curr Med Chem. 2019. PMID: 28982315 Review.
-
Current Aspects of the Role of Autoantibodies Directed Against Appetite-Regulating Hormones and the Gut Microbiome in Eating Disorders.Front Endocrinol (Lausanne). 2021 Apr 19;12:613983. doi: 10.3389/fendo.2021.613983. eCollection 2021. Front Endocrinol (Lausanne). 2021. PMID: 33953692 Free PMC article. Review.
Cited by
-
The Intestinal Microbiome in Bariatric Surgery Patients.Eur Eat Disord Rev. 2015 Nov;23(6):496-503. doi: 10.1002/erv.2400. Epub 2015 Oct 1. Eur Eat Disord Rev. 2015. PMID: 26426680 Free PMC article. Review.
-
Are the Gut Bacteria Telling Us to Eat or Not to Eat? Reviewing the Role of Gut Microbiota in the Etiology, Disease Progression and Treatment of Eating Disorders.Nutrients. 2017 Jun 14;9(6):602. doi: 10.3390/nu9060602. Nutrients. 2017. PMID: 28613252 Free PMC article. Review.
-
Gut Microbiota and the Neuroendocrine System.Neurotherapeutics. 2018 Jan;15(1):5-22. doi: 10.1007/s13311-017-0600-5. Neurotherapeutics. 2018. PMID: 29380303 Free PMC article. Review.
-
The Role of the Gut Microbiota in Anorexia Nervosa in Children and Adults-Systematic Review.Int J Mol Sci. 2023 Dec 19;25(1):41. doi: 10.3390/ijms25010041. Int J Mol Sci. 2023. PMID: 38203211 Free PMC article.
-
The Microbiota, the Gut and the Brain in Eating and Alcohol Use Disorders: A 'Ménage à Trois'?Alcohol Alcohol. 2017 Jul 1;52(4):403-413. doi: 10.1093/alcalc/agx024. Alcohol Alcohol. 2017. PMID: 28482009 Free PMC article.
References
-
- van Elburg A, Treasure J. Advances in the neurobiology of eating disorders. Curr Opin Psychiatry. 2013;26:556–561. - PubMed
-
- Kaye WH, Fudge JL, Paulus M. New insights into symptoms and neurocircuit function of anorexia nervosa. Nat Rev Neurosci. 2009;10:573–584. - PubMed
-
- Friederich H-C, Wu M, Simon JJ, Herzog W. Neurocircuit function in eating disorders. Int J Eating Disord. 2013;46:425–432. - PubMed
-
- Trace SE, Baker JH, Penas-Lledo E, Bulik CM. The genetics of eating disorders. Annu Rev Clin Pychol. 2013;9:589–620. - PubMed
Publication types
MeSH terms
Substances
LinkOut - more resources
Full Text Sources
Other Literature Sources
Medical
