. 2014 Oct 7;12(10):e1001962.
doi: 10.1371/journal.pbio.1001962. eCollection 2014 Oct.

Centromere-independent accumulation of cohesin at ectopic heterochromatin sites induces chromosome stretching during anaphase

Affiliations

Centromere-independent accumulation of cohesin at ectopic heterochromatin sites induces chromosome stretching during anaphase

Raquel A Oliveira et al. PLoS Biol. .

Abstract

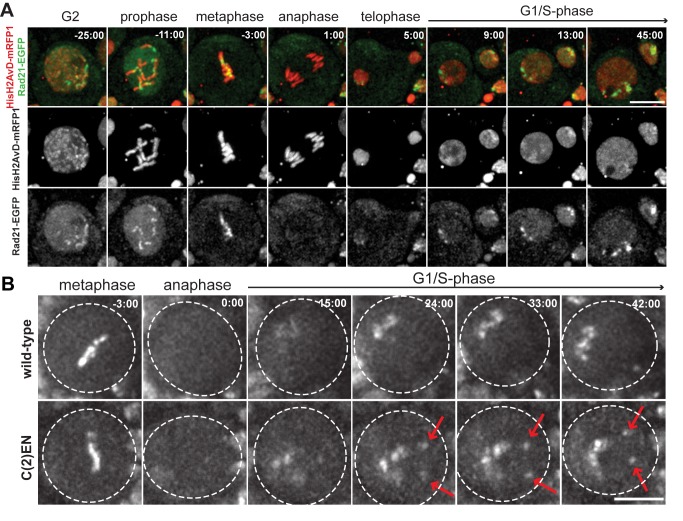
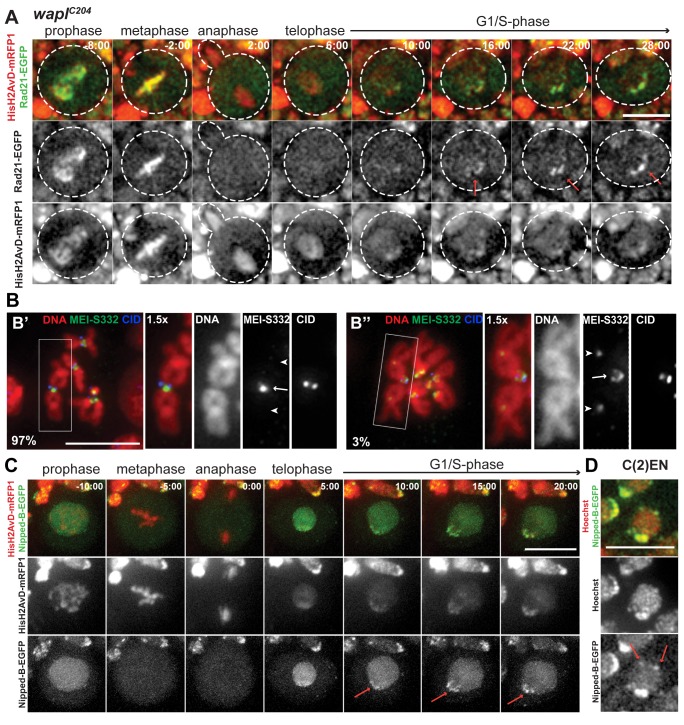
Pericentric heterochromatin, while often considered as "junk" DNA, plays important functions in chromosome biology. It contributes to sister chromatid cohesion, a process mediated by the cohesin complex that ensures proper genome segregation during nuclear division. Long stretches of heterochromatin are almost exclusively placed at centromere-proximal regions but it remains unclear if there is functional (or mechanistic) importance in linking the sites of sister chromatid cohesion to the chromosomal regions that mediate spindle attachment (the centromere). Using engineered chromosomes in Drosophila melanogaster, we demonstrate that cohesin enrichment is dictated by the presence of heterochromatin rather than centromere proximity. This preferential accumulation is caused by an enrichment of the cohesin-loading factor (Nipped-B/NIPBL/Scc2) at dense heterochromatic regions. As a result, chromosome translocations containing ectopic pericentric heterochromatin embedded in euchromatin display additional cohesin-dependent constrictions. These ectopic cohesion sites, placed away from the centromere, disjoin abnormally during anaphase and chromosomes exhibit a significant increase in length during anaphase (termed chromatin stretching). These results provide evidence that long stretches of heterochromatin distant from the centromere, as often found in many cancers, are sufficient to induce abnormal accumulation of cohesin at these sites and thereby compromise the fidelity of chromosome segregation.


Conflict of interest statement

The authors have declared that no competing interests exist.

Figures

Figure 1
Figure 1. Cohesin regulates constrictions at ectopic heterochromatic sites.
(A) Schematic representation of wild-type and C(2)EN karyotypes. Pericentric heterochromatin is labelled in orange, centromeres in red, and ectopic y-heterochromatin in yellow; (B) Spreads from larval brains from C(2)EN strains immunostained for Rad21-EGFP (green) to reveal cohesin localization at the pericentromeric region (centromeres labelled with CID, in blue) and at the displaced heterochromatic (H3diMeK9 labelled red in second left panel). Left panels show a 1.5× magnification of the C (2)EN chromosome and the fourth chromosome (inset) Scale bar is 5 µm; (C) Metaphase spreads after RNAi for the cohesin loader, Nipped-B, and the cohesin subunit, SA, showing premature SCS. Intact 2nd, 3rd, or C(2)EN chromosomes are boxed in the no RNAi control. Corresponding individual sister chromatids resulting from Nipped-B and SA RNAi are boxed in the right panels. Scale bar is 10 µm; (D) Graphical representation of percentage of SCS in C(2)EN cells after SA and Nipped-B RNAi (n = 25 for the no RNAi control, n = 27 for Nipped-B RNAi, and n = 26 for SA RNAi; datasets can be found in Table S2).
Figure 2
Figure 2. Live imaging reveals that cohesin is enriched at heterochromatic regions during G1/early S-phase.
(A) Drosophila larval neuroblasts cells containing Rad21-EGFP (green) and HisH2AvD-mRFP1 (red) display distinct Rad21 foci in early interphase prior to or during S-phase; (B) Stills from live-cell imaging of Rad21-EGFP in wild-type and C(2)EN neuroblast cells. Note that shortly after mitotic exit, a strong accumulation of Rad21-EGFP is detected at the pericentromeric region in wild-type cells and at two additional foci (arrows) in C(2)EN. Times 0∶00 equals anaphase onset. Scale bars are 10 µm.
Figure 3
Figure 3. Cohesin enrichment at pericentromeric regions results from preferential loading.
(A) Images from live analysis of larval neuroblasts in a waplC204 mutant background (Rad21-EGFP [green] and HisH2AvD-mRFP1 [red]). Note that Rad21-EGFP is still enriched at the pericentromeric regions (arrows). Time 0∶00 equals anaphase onset; (B) Spreads from larval brains from a C(2)EN strains immunostained for MEI-S332/Shugoshin (green) and CID (blue). DNA is shown in red. Percentages indicate the frequency of cells without (B′) and with (B′′) detectable MEI-S332 staining. In the vast majority of the cells, MEI-S332/Shugoshin is found at the pericentromeric regions (arrow) but not at the ectopic heterochromatin (arrow-heads); (C) Images from live analysis of Nipped-B-EGFP (green) in wild-type Drosophila neuroblasts demonstrate enrichment of this cohesin loader at heterochromatic regions during S-phase (arrows). DNA is labelled with HisH2AvD-mRFP1 (red). Time 0∶00 equals anaphase onset; (D) Image from live analysis of Nipped-B-EGFP (green) in C(2)EN-bearing Drosophila neuroblasts demonstrates enrichment at two additional foci distal to the pericentromeric cluster (arrows). DNA is labelled with Hoechst (red). Scale bars are 10 µm and apply to all images.
Figure 4
Figure 4. Cohesin degradation is delayed in C(2)EN and Wapl mutants.
(A) Images from live analysis of Rad21-EGFP dynamics in wild-type, C(2)EN, and waplC204 mutant neuroblast cells. Time 0∶00 equals anaphase onset and scale bars are 10 µm. (B) Relative fluorescence intensity (RFI) of Rad21-EGFP over time; levels were normalized to the time of mid-metaphase (3–4 min before anaphase); different movies were aligned to the anaphase timing, defined as the time where Rad21-EGFP levels have dropped below 85% (RFI <0.85). Each data point represents the average ± (standard error of the mean) SEM (datasets can be found in Table S2). A sigmoidal curve was used to fit the data; (C) Graphic representation of the slope of the sigmoidal curve (h). C(2)EN and waplC204 are significantly different from the controls (n≥10 for each condition, *p<0.05; ***p<0.0001, one-tailed students t-test); (D) Analysis of spatial distribution of Rad21-EGFP signal (green) during metaphase and early anaphase. DNA is labelled in red. Left intensity profiles were obtained by drawing a box, parallel to the segregation axis. Note that after anaphase onset, a significant peak of Rad21-EGFP signal can still be detected at the regions that lag behind the chromatin mass.
Figure 5
Figure 5. Displaced heterochromatin causes chromatin stretching during anaphase.
(A) Schematic of three chromosome rearrangements: Compound Chromosome 2 (C(2)EN), Translocation (2;3)ltX13 (T(2;3)ltX13), and Inversion (3LR)264 (In(3LR)264). The first two rearrangements but not the third result in displaced heterochromatin. Pericentric heterochromatin surrounding the centromeres (red) is depicted in orange whereas displaced heterochromatin is denoted in yellow; (B) Images from live analysis of segregating anaphase chromosomes in each of the three rearrangements. C(2)EN and T(2;3)ltX13 show lagging chromatids that considerably stretch during anaphase (arrows), whereas In(3LR)264 shows a long chromatid with no stretching. Time 0∶00 equals anaphase onset and scale bars are 10 µm; (C) Schematics of relative stretching measurements: the longest anaphase chromatid length was measured as depicted in the bottom panel and normalized to its metaphase size and to the average control length; (D) Relative chromatid stretching in wild-type, C(2)EN, T(2;3)ltX13, and In(3LR)264 strains. Note that the average anaphase chromosome length of In (3LR) 264 is as predicted by its metaphase length, whereas C(2)EN and T(2;3)ltX13 exhibit longer chromatids; datasets can be found in Table S2.
Figure 6
Figure 6. Relative position of ectopic heterochromatin domains reveals an anaphase-specific stretch.
(A) Schematic representation of the chromosomal location of the probes used; (B) FISH of wild-type cells showing that in anaphase cells these probes detect only centromere-proximal regions; (C) FISH of anaphases in C(2)EN-bearing strains showing the position of ectopic heterochromatin regions labelled by the indicated probes. Note that in these cells the ectopic heterochromatin appears totally unresolved (C′), forming chromatin bridges (C′′) or already resolved (C′′′). Graphs show the relative position of ectopic heterochromatin regions of C(2)EN chromosomes relative (D) to its entire chromosome length and (E) to the length of Chromosome III; (n≥20, ***p<0.0001, two-tailed students t-test; datasets can be found in Table S2).
Figure 7
Figure 7. Wapl mutants exhibit chromosome stretching during anaphase.
(A) Live-imaging of chromosomes in wild-type and waplC204 neuroblast cells. Time 0∶00 equals anaphase onset and scale bars is 10 µm. (B) Quantification of anaphase chromosome length in wild-type and waplC204. waplC204 are significantly longer than wild-type cells (n≥10, ***p<0.0001, one-tailed students t-test; datasets can be found in Table S2); (C) Anaphase chromatid length plotted relatively to the metaphase area showing no significant correlation between stretched chromosomes and the organization of the metaphase plate.

References

    1. Topp CN, Dawe RK (2006) Reinterpreting pericentromeric heterochromatin. Curr Opin Plant Biol 9: 647–653. - PubMed
    1. Guacci V, Koshland D, Strunnikov A (1997) A direct link between sister chromatid cohesion and chromosome condensation revealed through the analysis of MCD1 in S. cerevisiae. Cell 91: 47–57. - PMC - PubMed
    1. Michaelis C, Ciosk R, Nasmyth K (1997) Cohesins: chromosomal proteins that prevent premature separation of sister chromatids. Cell 91: 35–45. - PubMed
    1. Haering CH, Farcas AM, Arumugam P, Metson J, Nasmyth K (2008) The cohesin ring concatenates sister DNA molecules. Nature 454: 297–301. - PubMed
    1. Uhlmann F, Lottspeich F, Nasmyth K (1999) Sister-chromatid separation at anaphase onset is promoted by cleavage of the cohesin subunit Scc1. Nature 400: 37–42. - PubMed

Publication types