. 2015 May;8(3):596-606.
doi: 10.1038/mi.2014.91. Epub 2014 Oct 8.

Maturation of mast cell progenitors to mucosal mast cells during allergic pulmonary inflammation in mice

Affiliations

Maturation of mast cell progenitors to mucosal mast cells during allergic pulmonary inflammation in mice

L G Bankova et al. Mucosal Immunol. 2015 May.

Abstract

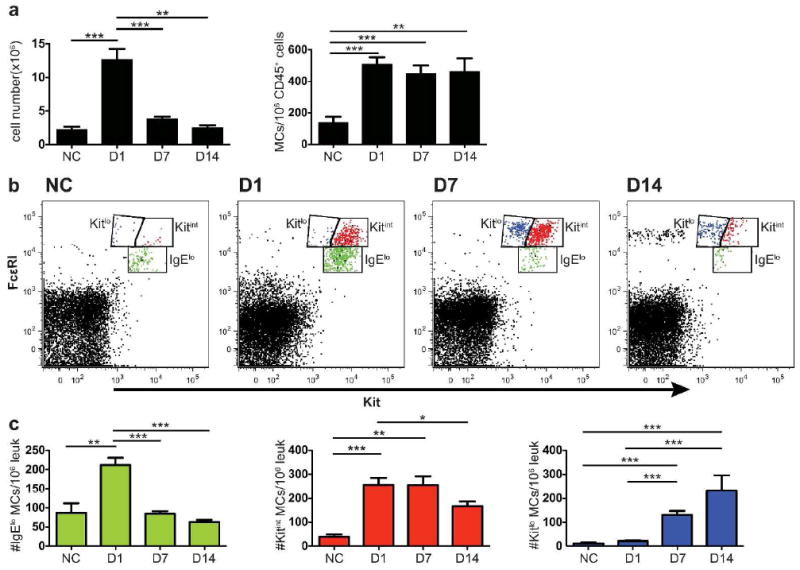
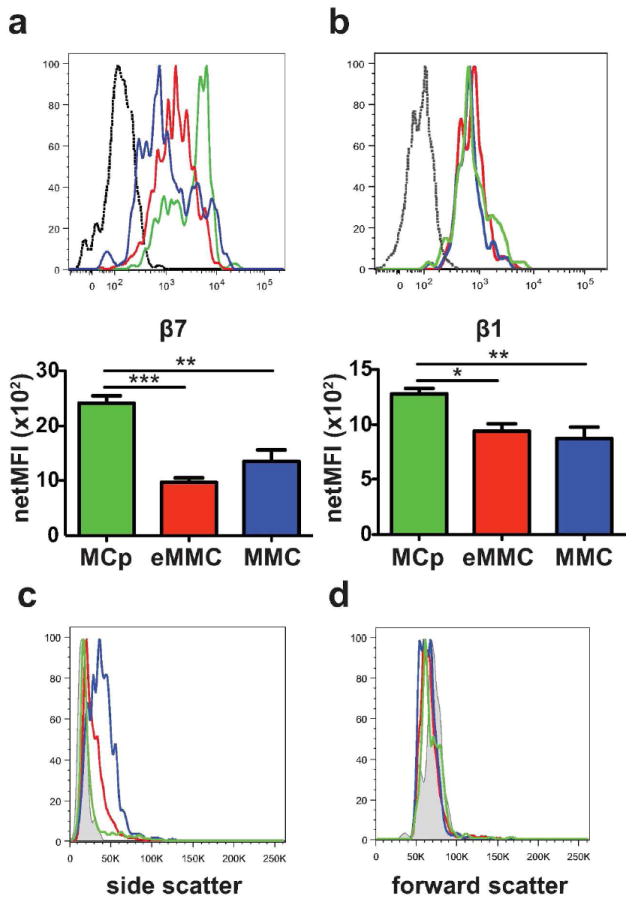
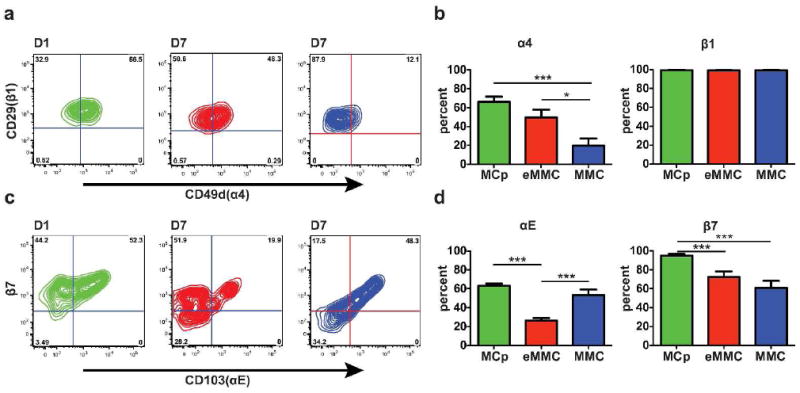
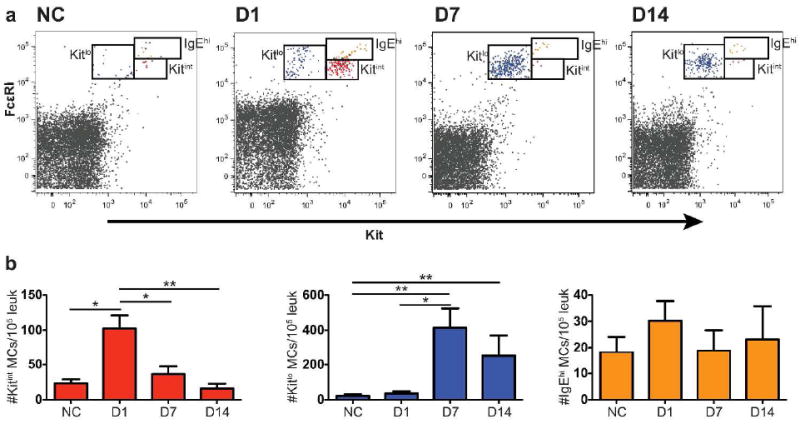
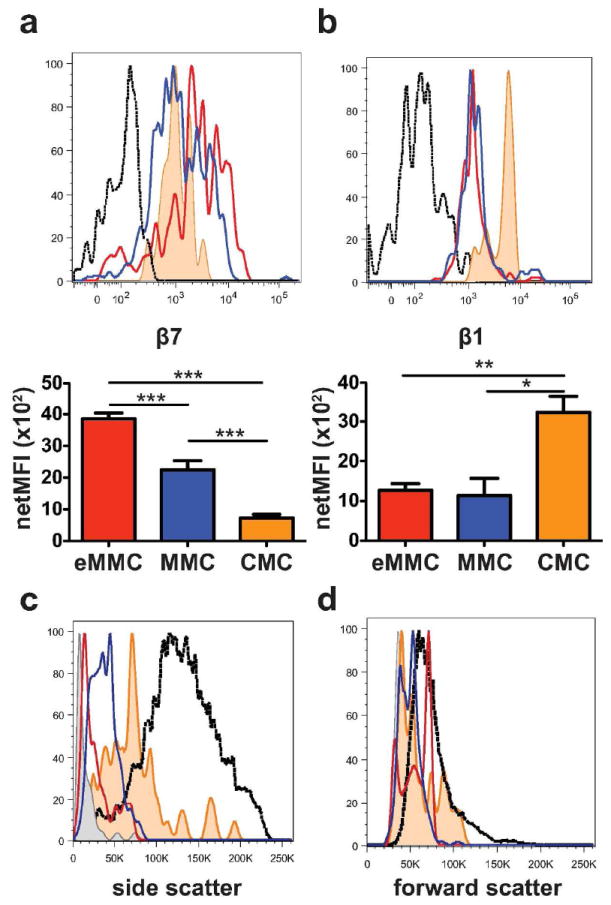
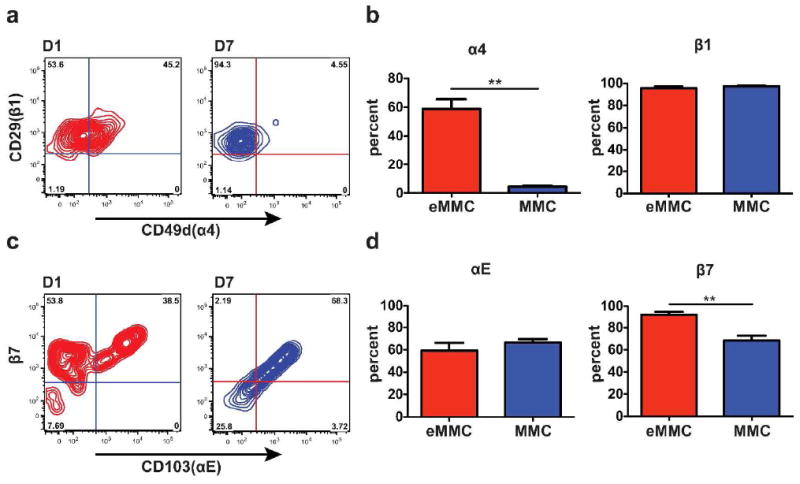
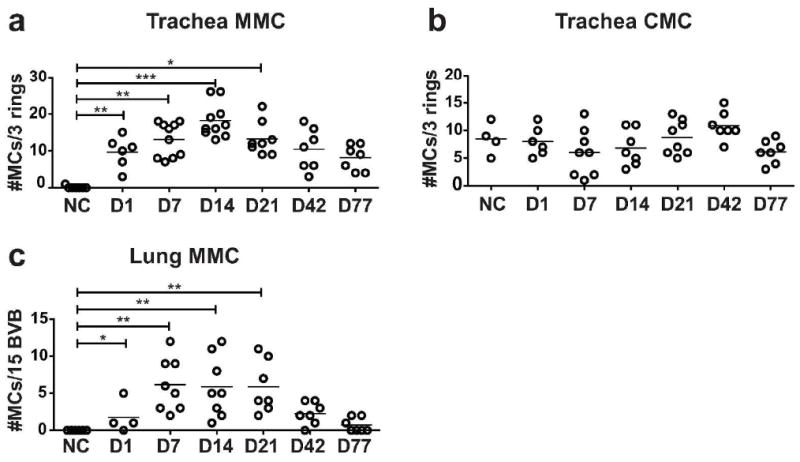
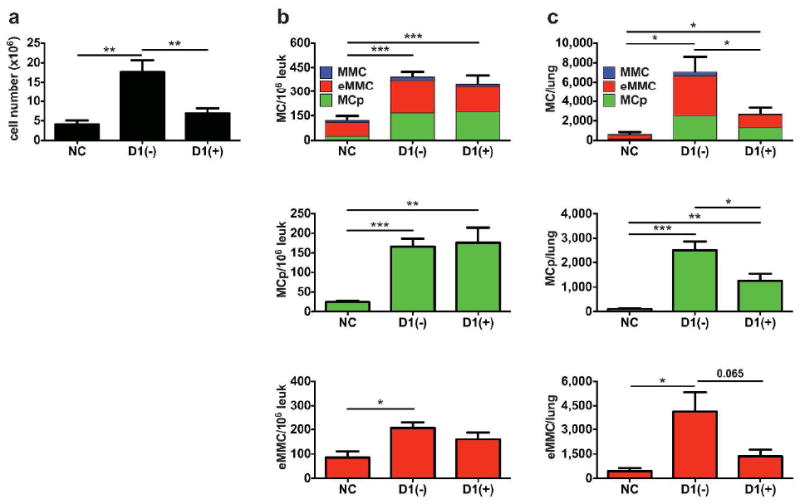
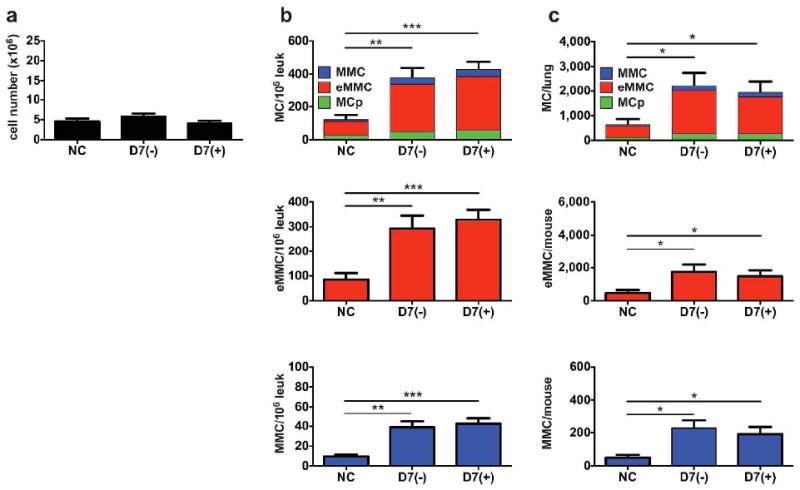
In contrast to resident constitutive mast cells (CMCs), mucosal MCs (MMCs) appear in the lung and trachea of sensitized mice only following inhalation challenge. We monitored the influx and maturation of MCs by their expression of Kit, FcɛRI, β7-integrin and side scatter (SSC) by flow cytometry. Influx of MC progenitors (MCps) (FcɛRI(lo), Kit(int), β7(hi), and SSC(lo)) peaks 1 day after challenges and subsides to baseline by day 7 after challenge. The mature MMCs appear as a distinct population on day 7 and peak at day 14 with higher SSC and FcɛRI expression, but lower β7 and Kit expression. A distinct transitional population is present between 1 and 7 days after challenge. Maturation occurs more rapidly in the trachea. The resident tracheal CMCs had higher SSC, FcɛRI, and Kit and lower β7-integrin expression than the MMCs. By histology, the MMCs follow similar kinetics to the flow cytometry-identified mature MMCs and are notably persistent for >42 days. Steroid treatment reduced inflammation and MCp influx but had no effect on established MMCs. Thus, changes in SSC, FcɛRI, and Kit together with the expression of αE/α4:β7-integrins characterizes the development of induced MMCs from MCps and distinguishes them from resident CMCs in the trachea and large airways.


Conflict of interest statement

Disclosure

The authors declare no competing financial interests

Figures

Figure 1
Figure 1
Induction of 3 populations of MCs in lung of BALB/c mice 1 to 14 days after challenges. BALB/c mice were sensitized and either not challenged (NC) or challenged for 7 consecutive days with aerosolized antigen. The lung cells were isolated and analyzed by FACS on D1, D7, and D14 after the challenges. (a) Mean leukocyte cell counts (left panel) and mean number of FcεR1+Kit+ MCs/106 CD45+CD3-CD19-CD11b-cells in the lung, determined by FACS (right panel). (b) Representative dot plots of lung cells from NC and challenged mice analyzed for FcεR1 and Kit. Three different FcεRI+Kit+ populations are designated and colored as follows: FcεRIloKitint – green, FcεRIintKitint – red and FcεRIintKitlo – blue. (c) Concentration (number/106 CD45+ leukocytes) of lung MC lineage populations (FcεR1+Kit+) colored as in (b). Bar graphs represent means ± SEMs from 5 experiments with 7-15 mice/group. * p < 0.05, **p < 0.01, ***p < 0.001
Figure 2
Figure 2
Expression of β7 and β1 integrins and forward and side scatter characteristics of inducible lung MC populations at D7 after challenges. (a) Representative histograms (top panel) and mean (± SEM) net MFI (bottom panel) of β7 integrin expression by the 3 populations of lung MCs: MCp -green, eMMC -red and MMC -blue; black dotted line -isotype control. Net MFI was determined by subtracting the value of the isotype control. (b) Representative histograms (top panel) and mean (± SEM) net MFI (bottom panel) of β1 (CD29) integrin expression by the 3 populations of lung MCs (top panel) colored as in a. (c) Representative histograms show the side scatter profile of the 3 lung MC populations colored as in a. Grey shaded area indicates immature spleen MCp. (d) Representative histograms show the forward scatter profile of the 3 lung MC populations compared to spleen MCp as in c. Histograms in c and d show the mean value from 2-3 mice/group from one of 5 experiments. Bar graphs present means ± SEMs from 3-5 separate experiments with 5-13 mice per group.
Figure 3
Figure 3
Expression of α4, αE, β7, and β1 integrins on the inducible MC populations in the lung. (a) Representative contour plots presenting the expression of α4 and β1 integrins on MCp (green) on D1, eMMC (red) on D7 and MMC (blue) on D7. (b) Mean ± SEM percentage of cells positive for α4 and β1 integrins in each of the 3 MC populations colored as in a.(c) Representative contour plots presenting the expression of αE and β7 on the MCp, eMMC and MMC as in a. (d) Mean ± SEM percentage of cells positive for αE and β7 integrins in each of the three MC populations colored as in a. Data in b and d are from 4 experiments with 8-12 mice per group. *p < 0.05, ***p < 0.001.
Figure 4
Figure 4
Induction of 2 populations of MCs in trachea of BALB/c mice 1 to 14 days after challenges. (a) Representative dot plots of tracheal MCs showing the resident CMC population, the FcεRIhiKithi cells (colored orange) and the induced eMMC (red) and MMC (blue) populations in NC mice and in mice D1, D7 and D14 after challenges from 1 of 3 experiments. (b) Mean ± SEM concentration (MCs/105 CD45+ leukocytes) of CMCs, eMMCs, and MMCs colored as in a. Data are means ± SEMs from 5 experiments with 6-15 mice per group. *p < 0.05, **p < 0.01.
Figure 5
Figure 5
Expression of β7 and β1 integrins and forward and side scatter characteristics of tracheal constitutive and inducible MC populations at D7 after challenges. (a) Representative histograms (top panel) and mean (± SEM) net MFI (bottom panel) of the β7 integrin expression on the 3 populations of tracheal MCs, CMCs (orange shaded), eMMCs (red) and MMCs (blue); black dotted line -isotype control. (b) Representative histograms (top panel) and mean (± SEM) net MFI (bottom panel) of the β1 (CD29) integrin expression on the 3 populations of tracheal MCs colored as in a. (c) Representative histograms of the side scatter characteristics of the 3 MC populations in trachea (colored as in a and compared with splenic MCp (grey shaded) and intraperitoneal MCs (back dotted line). (d) Forward scatter characteristics of tracheal, splenic and intraperitoneal MC populations as in c. Histograms in c and d show the mean value from 2-3 mice/group from one of 5 experiments. Bar graphs represent mean (± SEM) from 4 experiments with 5-8 mice per group *p < 0.05, **p < 0.01, ***p < 0.001.
Figure 6
Figure 6
Expression of α4, αE, β7, and β1 integrins on the constitutive and inducible MC populations in the trachea. (a) Representative contour plots presenting the expression of α4 and β1 integrins on eMMCs (red) on D1, and MMCs (blue) on D7 after challenges. (b) Mean (±SEM) percentage of cells positive for α4 and β1 integrins in the 2 MC populations, D1 eMMCs, and D7 MMCs as in a.(c) Representative contour plots presenting the expression of αE and β7 integrins colored as in a. (d) Mean (± SEM) percentage of cells positive for αE and β7 integrins in the 2 MC populations colored as in a. Data are from 4 experiments with 4-8 mice per group. **p < 0.001.
Figure 7
Figure 7
Persistence of histological MMC hyperplasia in the lung and trachea. Time course showing the changes in the numbers of MMCs and CMCs in trachea and MMCs in large airways of sensitized BALB/c mice challenged up to 77 days previously or unchallenged, as assessed by histology. (a) The number of interepithelial MMCs per 3 tracheal rings. (b) The number of submucosal CMCs per 3 tracheal rings. (c) The number of interepithelial MMCs per 15 bronchovascular bundles (BVB) assessed in the large bronchi (greater than 200 μm). Each dot is a separate mouse and the bar indicates mean value from 4 experiments. *p< 0.05, **p< 0.01, ***p< 0.001.
Figure 8
Figure 8
Effect of systemic steroids on the recruitment of MCps and appearance of eMMCs in the lung of BALB/c mice. Sensitized mice were given either HBSS (-) or prednisone (+) i.p. every other day during the challenge phase. The CD45+ lung cells were isolated and analyzed by FACS on D1 after the challenges. (a) Mean counts of leukocytes from the lung preparations. (b) Concentration of FcεR1+Kit+MCs/106 CD45+ cells in the lung determined by FACS. Top panel; stacked bars represent the concentration of all MCs and show the relative contribution of MCp (green), eMMC (red) and MMC (blue) to the total number. Middle and bottom panel are bar graphs of the distinct populations that are predominant on D1, MCp (green) and eMMC (red). (c) Total number of MCs per lung in the same mice as in (b). Bar graphs represent means ± SEMs from 3 experiments with 9-12 mice/group. * p < 0.05, ** p < 0.01
Figure 9
Figure 9
Effect of systemic steroids on the post challenge presence of induced MCs in the lung of BALB/c mice. Sensitized and challenged mice were given 4 doses of HBSS (-) or prednisone (+) i.p. every other day for 7 days after the challenge phase starting on D1 post challenge. The lung cells were isolated and analyzed by FACS on D7 after the challenges. (a) Mean cell counts of leukocytes from the lung preparations. (b) Concentration of FcεR1+Kit+MCs/106 CD45+ cells in the lung determined by FACS. Top panel; stacked bars represent the concentration of all MCs and show the relative contribution of the MCp (green), eMMC (red) and MMC (blue) to the total number. Middle and bottom panels are bar graphs of the distinct populations that are predominant on D7 – eMMC (red) and MMC (blue). (c) Total number of MCs per lung in the same mice as in (b). Bar graphs represent means ± SEMs from 3 experiments with 9 mice/group. * p < 0.05.

References

    1. Mota I, Vugman I. Effects of anaphylactic shock and compound 48/80 on the mast cells of the guinea pig lung. Nature. 1956;177:427–429. - PubMed
    1. Paterson NA, Wasserman SI, Said JW, Austen KF. Release of chemical mediators from partially purified human lung mast cells. J Immunol. 1976;117:1356–1362. - PubMed
    1. Razin E, Mencia-Huerta JM, Lewis RA, Corey EJ, Austen KF. Generation of leukotriene C4 from a subclass of mast cells differentiated in vitro from mouse bone marrow. Proc Natl Acad Sci U S A. 1982;79:4665–4667. - PMC - PubMed
    1. Enerback L. Mast cells in rat gastrointestinal mucosa. 2. Dye-binding and metachromatic properties. Acta Pathol Microbiol Scand. 1966;66:303–312. - PubMed
    1. Fukuzumi T, et al. Differences in irradiation susceptibility and turnover between mucosal and connective tissue-type mast cells of mice. Exp Hematol. 1990;18:843–847. - PubMed

Publication types

MeSH terms