. 2015 Feb 1;24(3):698-713.
doi: 10.1093/hmg/ddu489. Epub 2014 Oct 6.

Co-ordinated brain and craniofacial development depend upon Patched1/XIAP regulation of cell survival

Affiliations

Co-ordinated brain and craniofacial development depend upon Patched1/XIAP regulation of cell survival

Kazushi Aoto et al. Hum Mol Genet. .

Abstract

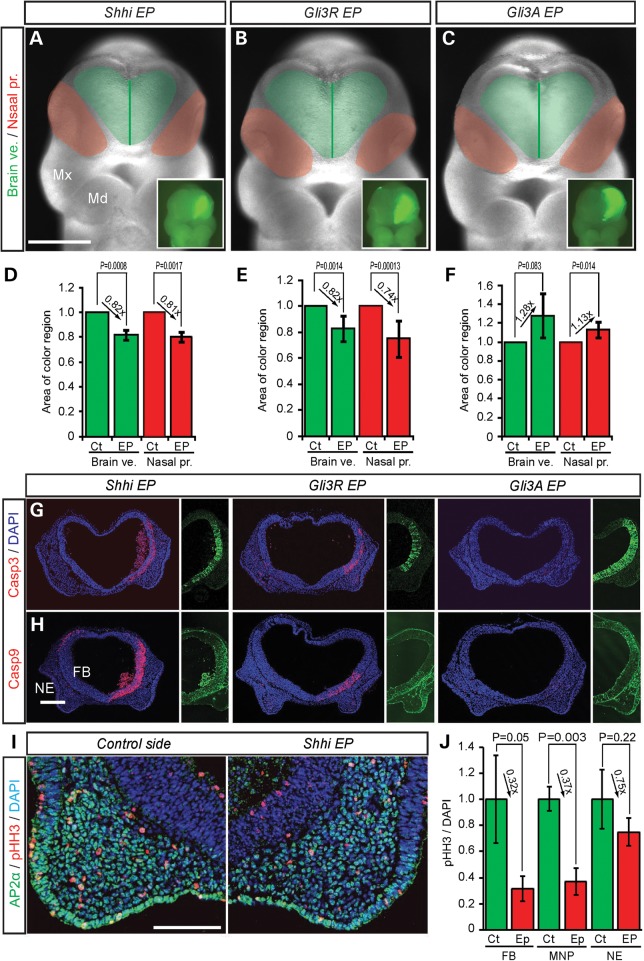
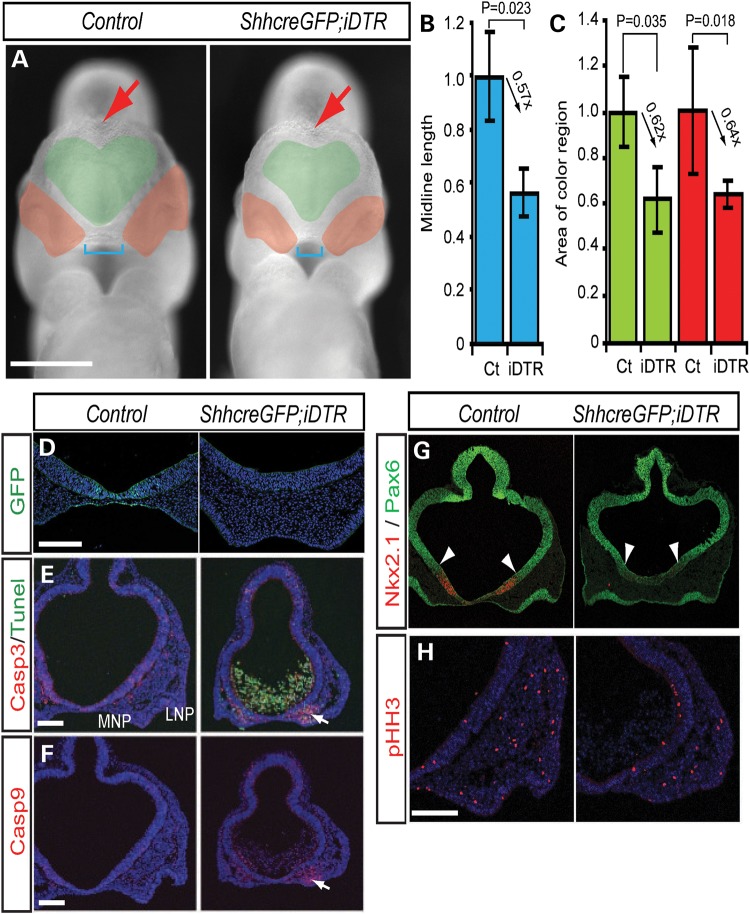
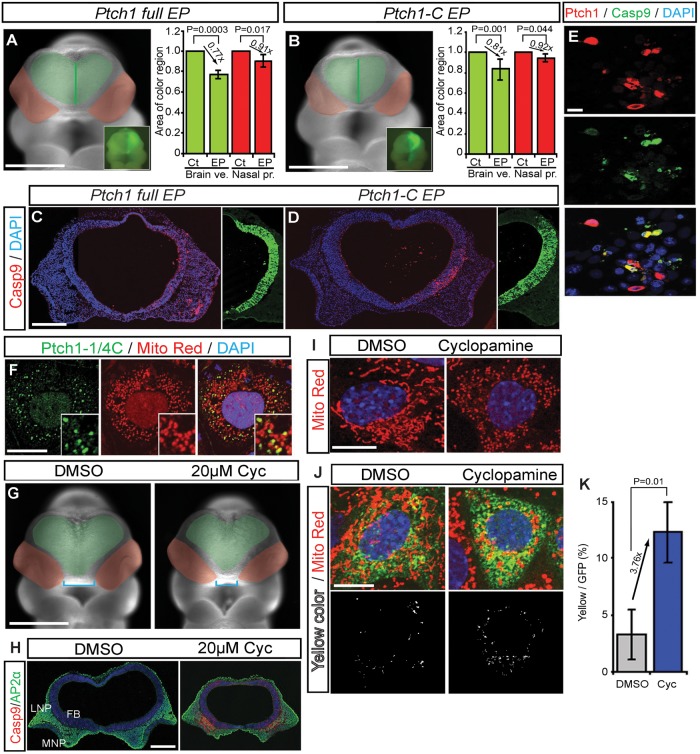
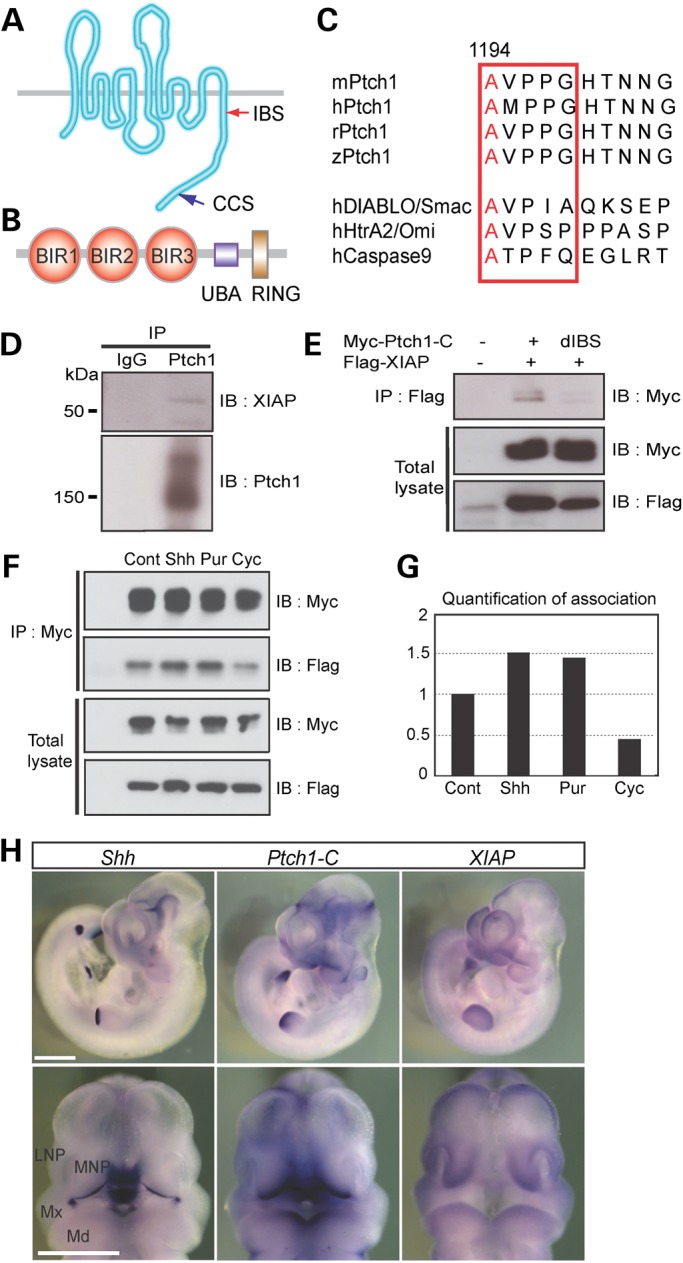
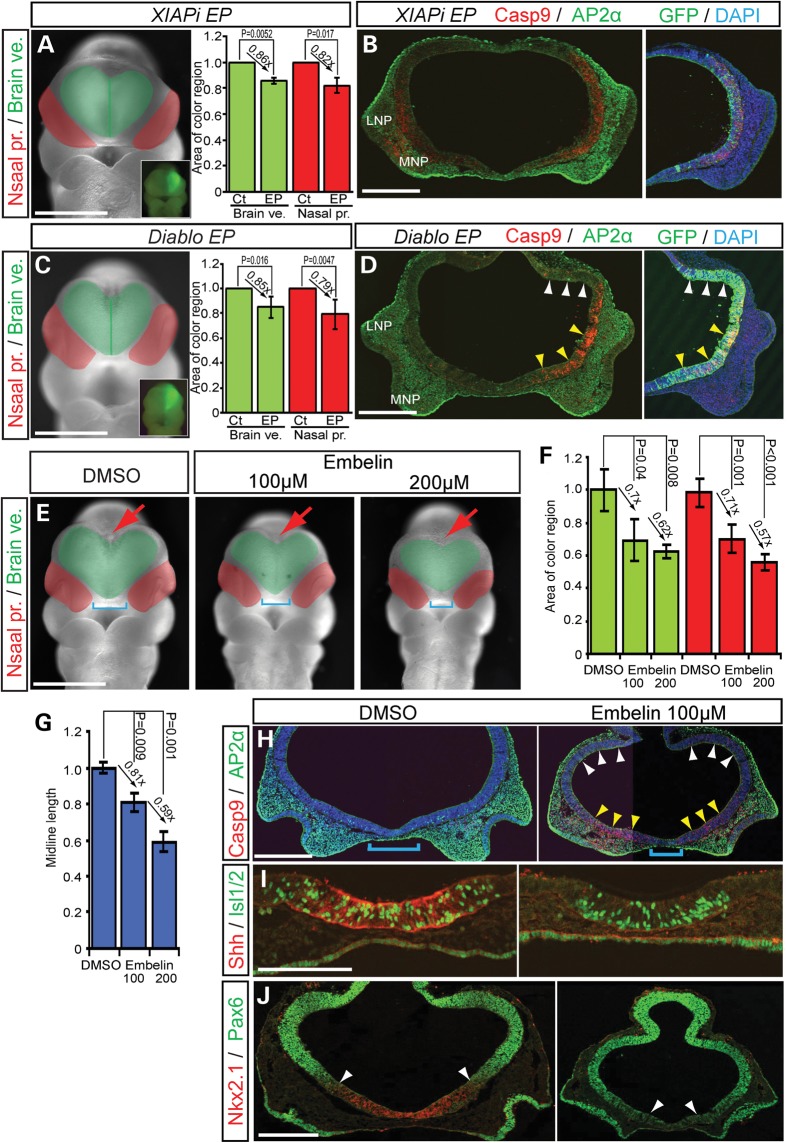
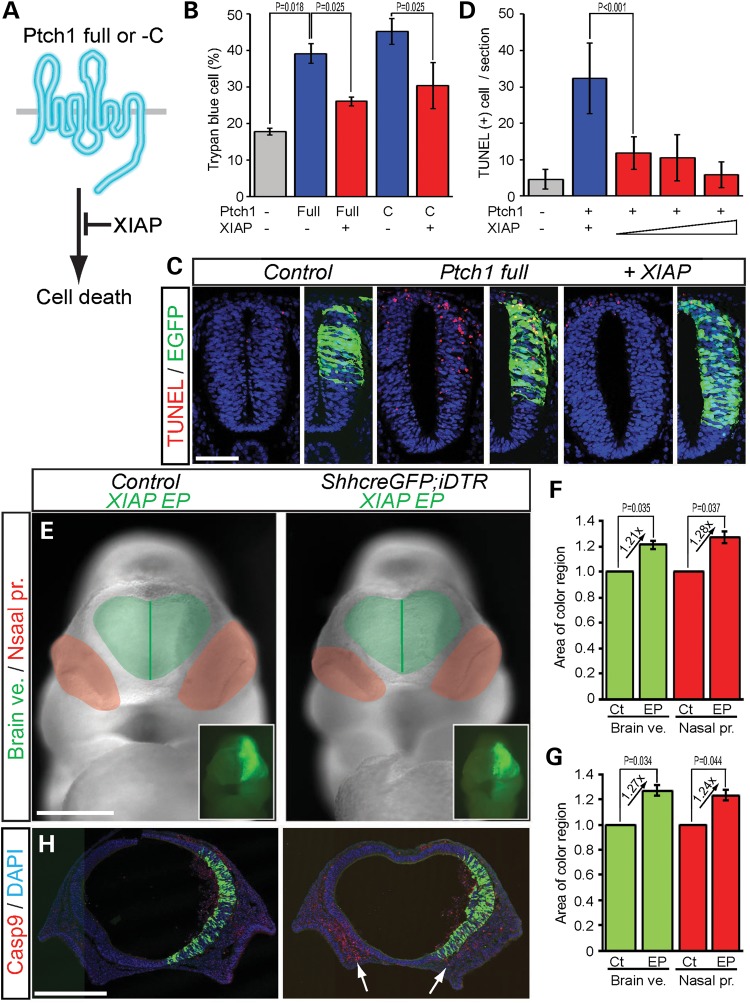
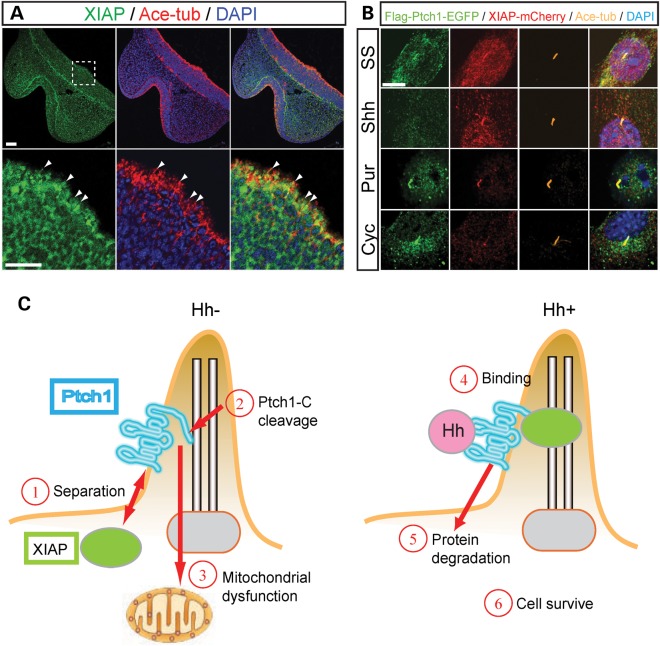
Congenital brain and craniofacial defects often occur together as a consequence of their developmental dependency on common progenitor tissue interactions and signaling pathways during embryogenesis. A classic example of this is perturbation of midline embryo development, and disruption of Hedgehog (Hh) signaling in the pathogenesis of holoprosencephaly. However, our understanding of how Hh signaling governs cell and tissue survival remains incomplete. Patched1 (Ptch1) is a well-known receptor for Hh ligands and Ptch1 overexpression is associated with cell and tissue-specific apoptosis. Here, we demonstrate that the X-linked inhibitory apoptosis protein (XIAP) associates with the C terminus of Ptch1 (Ptch1-C) in primary cilia to inhibit Ptch1-mediated cell death. Consistent with this observation, inhibition of XIAP suppresses cell proliferation, resulting in cell death and pathogenesis of an Hh loss-of-function phenotype. Thus, co-ordinated development of the brain and face is dependent in part upon XIAP mediation of Hh/Ptch1-regulated cell survival and apoptosis during embryogenesis.


Figures

Figure 1.
Figure 1.
Hh signaling affects brain and facial development in mouse embryos. Frontal view of mouse embryos EP with Shh shRNAi (A), Gli3 repressor (Gli3R) (B), Gli3 activator (Gli3A) (C) and pEGFP as a reference. Light green area demarcates the brain vesicle (Brain ve.). The dark green lines represents the midline of the brain vesicle. Red colored areas demarcate the nasal processes (Nasal pr.). Inset panels show unilateral GFP EP. Comparisons of the relative size (mean ± s.d.) of brain vesicles (green bar) and nasal processes (red bar) from control non-EP sides (Ct) and EP sides for Shhi (D), Gli3R (E) and Gli3A (F). (G and H) Cleaved Casp3 and Casp9 labelling of frontal section of the front nasal process of EP embryos. Each half panels show unilateral GFP labeling in the brain. DAPI is a nuclear marker. (I) Double staining of frontal sections through the frontonasal process of Shhi EP embryos with neural crest marker, AP2α (green) and M-phase proliferation marker, phosphohiston H3 (pHH3, red). (J) Quantification of pHH3-positive cells in the forebrain (FB), medial nasal process (MNP) and nasal epithelium (NE). Md, mandibular process; Mx, maxillary process. Scale bars: 0.5 mm in (A)–(C); 0.2 mm in (G) and (H); 0.1 mm in (I).
Figure 2.
Figure 2.
Loss of Shh expressing cells is associated with mitochondrial-dependent cell death. (A) Frontal view of DT-treated control (DMSO) and ShhcreERT2; iDTR embryos. Green area demarcates the brain vesicle. Red area labels the nasal process. Blue brackets mark the length between left and right nasal processes. Red arrow indicate dorsal midline of forebrain hemispheres. (B and C) Quantification of midline length and relative size of (mean ± s.d.) of brain vesicles (Brain ve., green) and nasal processes (Nasal pro., red) from non-EP (Ct) and  EP sides. (DH) ShhcreERT2; iDTR embryos exhibit extensive cell death, altered dorso-ventral patterning and decreased proliferation. Shh expressing cells labelled with GFP in the ventral forebrain (D). Cell death labelling with cleaved casapse3 (Casp3), TUNEL (E) and cleaved Casp9 (F). Pax6 and Nkx2.1 (G) labelling of the dorsal-ventral forebrain, respectively, and phospho-histone H3 (pHH3) (H) labeling of mitotic cells. White arrows indicate cell death in the medial nasal process (E and F). White arrowheads indicate the boundary of Nkx2.1 and Pax6 expression (G).LNP, lateral nasal process; MNP, medial nasal process. Scale bars: 0.5 mm in (A); 0.2 mm in (D)–(G).
Figure 3.
Figure 3.
Caspase cleaved C-terminal Ptch1 translocates to mitochondria during cell death. (A and B) Frontal view of mouse embryos EP with myc-tagged Ptch1 full length (A) and Ptch1 C terminal (Ptch1-C) (B) with pEGFP as reference. Green area demarcates the brain vesicles. Red area indicates the nasal processes. Insets show unilateral electroporation of GFP in the forebrain. (C and D) Frontal sections of E9.5 mouse embryos labeled with cleaved Casp9 after unilateral brain electroporation with control, myc-tagged Ptch1 full-length (C) and Ptch1-C (D) vectors. Nuclei are stained with DAPI. (E) Ptch1 full-length overexpression (red) induces Casp9 activity (green) in mIMCD3 cells. (F) mIMCD3 cells transiently transfected with myc-tagged Ptc1-1/4C (Myc-Pct1-1/4C, green) co-localized with the mitochondria marker, MitoTracker Red. (G) Frontal views of control (DMSO) and 20 µm cyclopamine (Cyc, smoothened antagonist)-treated mouse embryos. (H) Frontal sections of cultured embryos, stained with Casp9 and AP2α. (I) Healthy mitochondria in mIMCD3 cells present with a long tubular shape. 5 µm cyclopamine-treated cells exhibit mitochondria with small bean-shaped morphology. (J) Flag-Ptch1-EGFP stable cells stained with MitoTracker Red under normal and cyclopamine-treated conditions. Mitochondrial localized Ptch1 is indicated by yellow color. (K) Quantification of cyclopamine induces Ptch1 localization in mitochondria. FB, forebrain; FE, foregut endoderm; E, eye; HB, hindbrain. Scale bars: 0.5 mm in (A), (B) and (G); 0.1 mm in (E); 0.2 mm in (C), (D) and (H); 50 µm in (I) and (J).
Figure 4.
Figure 4.
IAP-binding domain of Ptch1 associated with the BIR domain of XIAP. (A and B) Schematic representations of mouse Ptch1 (A) with IBS and caspase cleaved site (CCS) and XIAP (B) protein with Buculovirus IAP repeat domain (BIR, red circle), ubiquitin-associated domain (UBA, blue square) and RING zinc finger domain (RING, blown square). (C) Ptch1-C contains an IBS (red square) that is highly conserved and similar to known IAP-binding proteins. (D) Immunoprecipitation using Ptch1 antibody and western blot analysis of whole-cell lysates from E11.5 mouse embryos. Ptch1 interacts with XIAP. (E) Immunoprecipitation using flag antibody and western blot analysis of whole-cell lysates from myc-tagged Ptch1 C-terminal (Myc-Ptch1-C) or IBS deletion mutant (dIBS) and flag-tagged XIAP (Flag-XIAP) transfected human embryonic kidney cells (HEK293T). dIBS of Ptch1-C cannot associated with XIAP. (F) Association of Ptch1 and XIAP is affected by Shh ligand, purmorphamine (Pur, smoothened agonist) and cyclopamine (Cyc, smoothened antagonist). (G) Quantification of Ptch1 and XIAP association measured from (F). (H) Whole-mount in situ hybridization of Shh, Ptch1-C and XIAP mRNA expression in E10.5 mouse embryos. Upper panels show left side of whole embryos, whereas lower panels show frontal views. LNP, lateral nasal process; Md, mandibular process; MNP, medial nasal process; Mx, maxillary process. Scale bars: 1 mm in (H).
Figure 5.
Figure 5.
XIAP inhibitor treated embryos develop HPE like phenotypes. (A and C) Frontal view of mouse embryos EP with XIAP shRNAi, and XIAP inhibitor, Diablo and pEGFP as a reference. Green area demarcates the brain vesicle. Red area indicates the nasal processes. Insets show unilateral electroporation of GFP in the forebrain. Quantification of relative size of (mean ± s.d.) of brain vesicles (Brain ve., green) and nasal processes (Nasal pro., red) from non-EP (Ct) and EP sides. (D) Diablo expression induces cell death in the ventral forebrain, but not in dorsal forebrain. (B, D) Cleaved Casp9 and AP2α staining in frontal sections of the front nasal region of EP embryos. Nuclei are stained with DAPI. (E) Frontal views of control (DMSO) and Embelin (100, 200 μm)-treated embryos. Blue brackets indicate the distance between the nasal processes. Red arrows illustrate the dorsal midline of the forebrain. (F and G) Quantification of midline length and relative size of (mean ± s.d.) of brain vesicles (Brain ve., green) and nasal processes (Nasal pro., red) from non-EP (Ct) and EP sides. (HJ) Embelin-treated embryos stimulate Casp9-positive cell death in ventral forebrain and neural crest (AP2α)-derived mesenchyme of medial nasal process, in associated with a decrease in Shh, Islet1/2 (Isl1/2) and Nkx2.1 activity in the ventral forebrain (I). Conversely, the domain of Pax6 expanded ventrally consistent with altered dorso-ventral patterning. White arrowheads demarcate the dorso-ventral border between Nkx2.1 and Pax6 expression. LNP, lateral nasal process; MNP, medial nasal process. Scale bars: 0.5 mm in (A)–(H) and (J); 0.2 mm in (I).
Figure 6.
Figure 6.
XIAP inhibits Ptch1 induction of cell death. (A) Schematic illustration of inhibition of mouse Ptch1 induction of cell death by XIAP. (B) Quantification of XIAP inhibition of Ptch1 full-length and C-terminal induction of Trypan blue-positive cell death in HEK293T cells. (C and D) XIAP inhibits Ptch1 induction of TUNEL-positive cell death in chick neural tube. (E) XIAP rescued nasal process morphology in Diphtheria toxin treated ShhcreGFP; iDTR embryos. (F and G) Quantification of relative area of brain vesicles (Brain ve., green) and nasal processes (Nasal pro., red) from non-EP (Ct) and XIAP EP sides of Control and ShhcreGFP; iDTR embryos. (H) XIAP inhibits Casp9-dependent cell death in the ventral forebrain and mesenchyme of the medial nasal processes (white arrows). Scale bars: 0.1 mm in (C) and (J); 0.5 mm in (E) and (H).
Figure 7.
Figure 7.
Ptch1 and XIAP are associated in primary cilia. (A) XIAP and acetylated-tubulin (Ace-tub) expression in frontal sections of E10.5 mouse embryos. Lower panels are high magnification of white dashed square of upper panels. XIAP protein localized to primary cilia (white arrowheads) and cytoplasm in ventral forebrain neuroepithelium. Ace-tub and DAPI label primary cilia and nuclei, respectively. (B) N-terminal Flag/C-terminal EGFP-tagged Ptch1 and mCherry-tagged XIAP are stably expressed in NIH3T3FRT cells under serum starvation (SS), Sonic Hh condition medium (Shh), purmorphamine (Smo agonist, Pur) and cyclopamine (Smo antagonist, Cyc)-treated conditions. (C) Model of Ptch1 (blue) and XIAP (green circle) association with/without Hh (pink circle) ligand in primary cilia. Without Hh, Ptch1 separates from XIAP (1). Ptch1 C-terminal domain is cleaved (2) and then C-terminal product induces mitochondrial dysfunction leading to cell death (3). When Hh binds to Ptch1 (4), Hh and Ptch1 are degraded leading to cell survival (5, 6). Scale bars: 50 µm in (A); 5 µm in (B).

Similar articles

Cited by

References

    1. Trainor P.A. Craniofacial birth defects: the role of neural crest cells in the etiology and pathogenesis of Treacher Collins syndrome and the potential for prevention. Am. J. Med. Genet. A. 2010;152A:2984–2994. - PMC - PubMed
    1. Demyer W., Zeman W., Palmer C.G. The face predicts the brain: diagnostic significance of median facial anomalies for holoprosencephaly (arhinencephaly) Pediatrics. 1964;34:256–263. - PubMed
    1. Cohen M.M., Jr Perspectives on holoprosencephaly: part III. Spectra, distinctions, continuities, and discontinuities. Am. J. Med. Genet. 1989;34:271–288. - PubMed
    1. Cohen M.M., Jr, Shiota K. Teratogenesis of holoprosencephaly. Am. J. Med. Genet. 2002;109:1–15. - PubMed
    1. Aoto K., Yayoi S., Higashiyama D., Shiota K., Motoyama J. Fetal ethanol exposure activates protein kinase A and impairs Shh expression in prechordal mesendoderm cells in the pathogenesis of holoprosencephaly. Birth Defects Res. A Clin. Mol. Teratol. 2008;82:224–231. - PubMed

Publication types

MeSH terms