. 2015 Jan;56(1):81-97.
doi: 10.1194/jlr.M053439. Epub 2014 Oct 7.

Pathways of cholesterol homeostasis in mouse retina responsive to dietary and pharmacologic treatments

Affiliations

Pathways of cholesterol homeostasis in mouse retina responsive to dietary and pharmacologic treatments

Wenchao Zheng et al. J Lipid Res. 2015 Jan.

Abstract

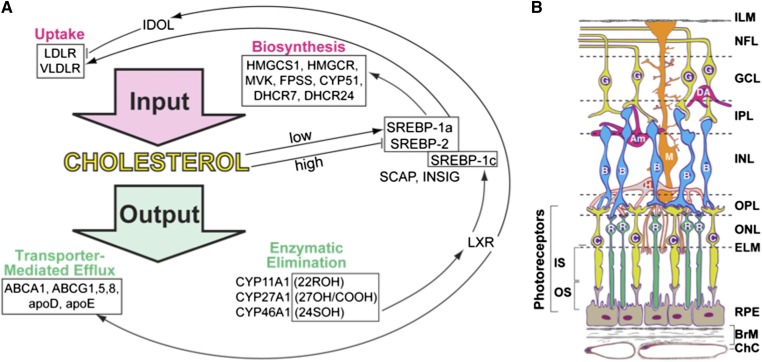
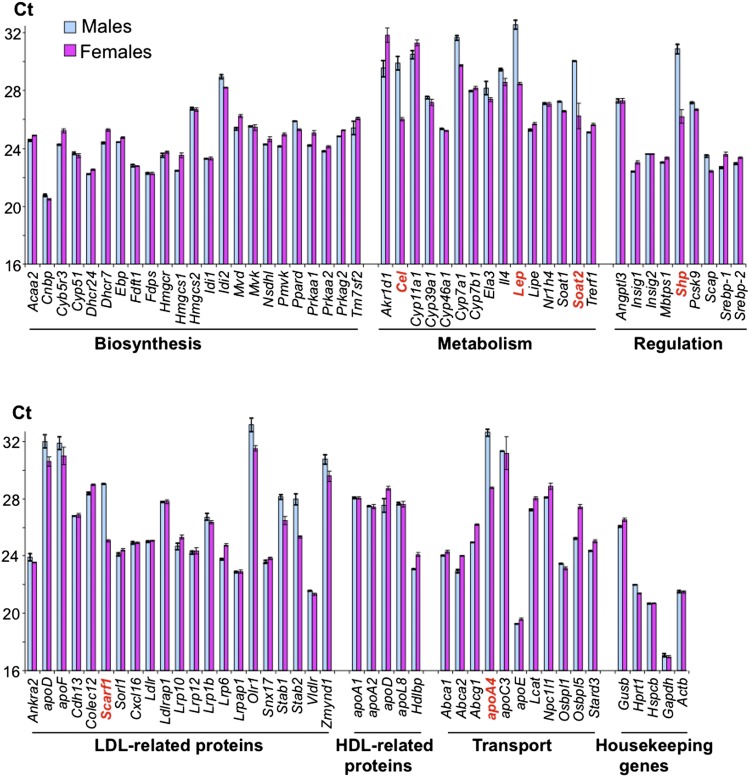
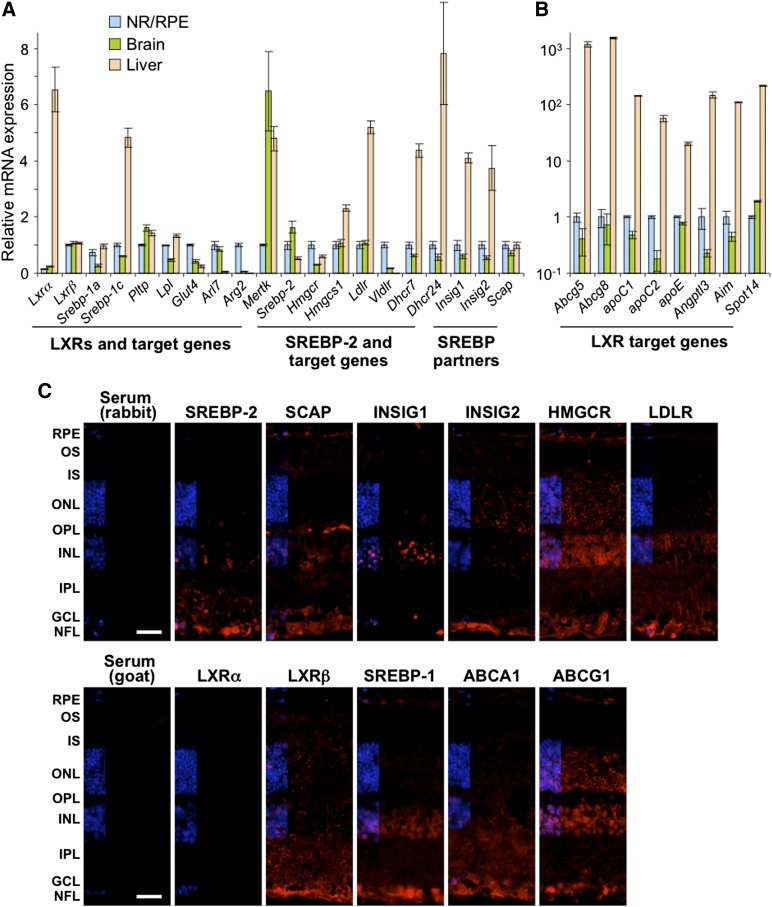
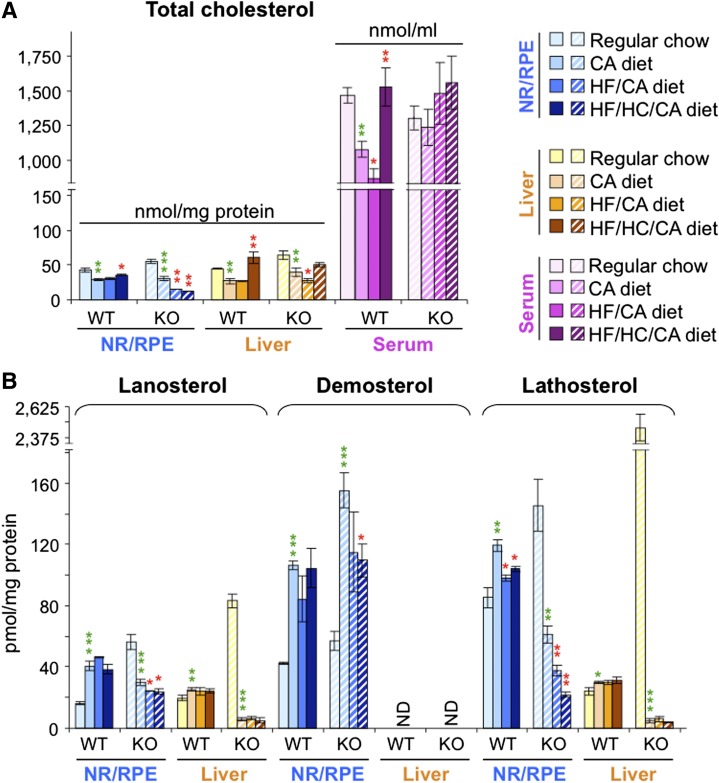
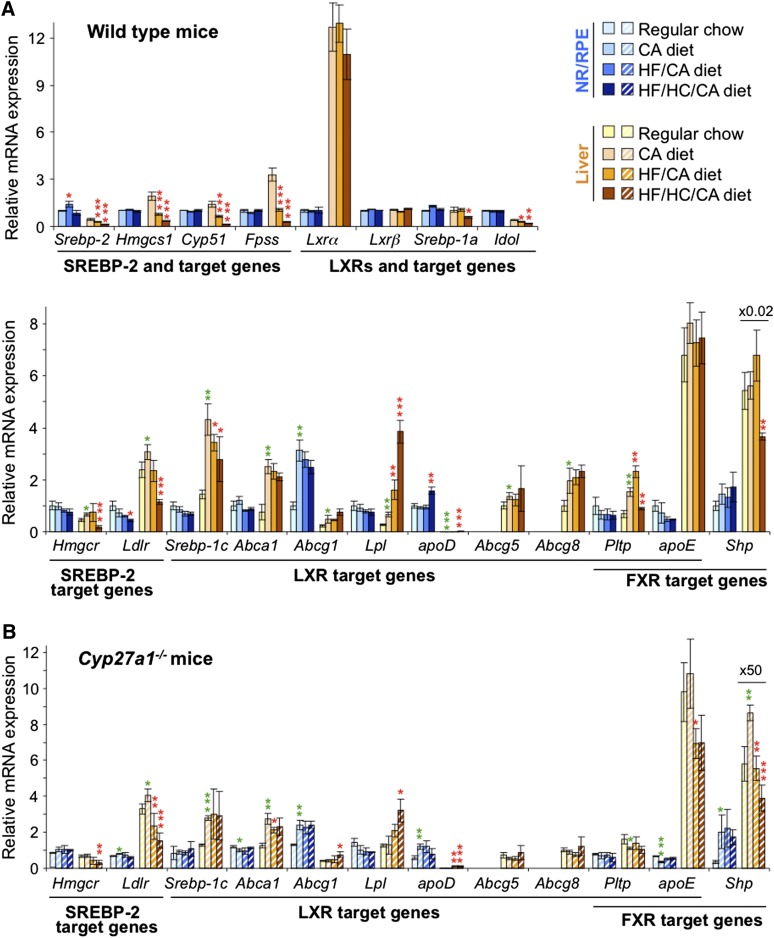
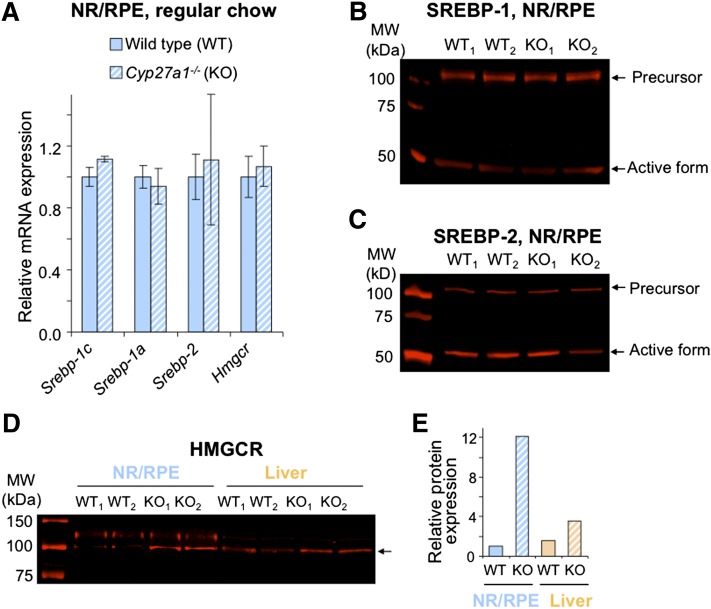
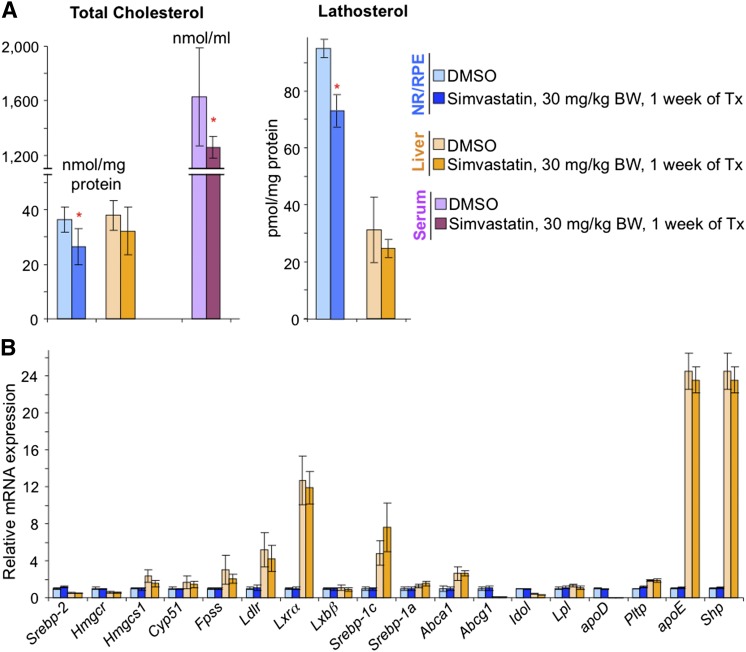
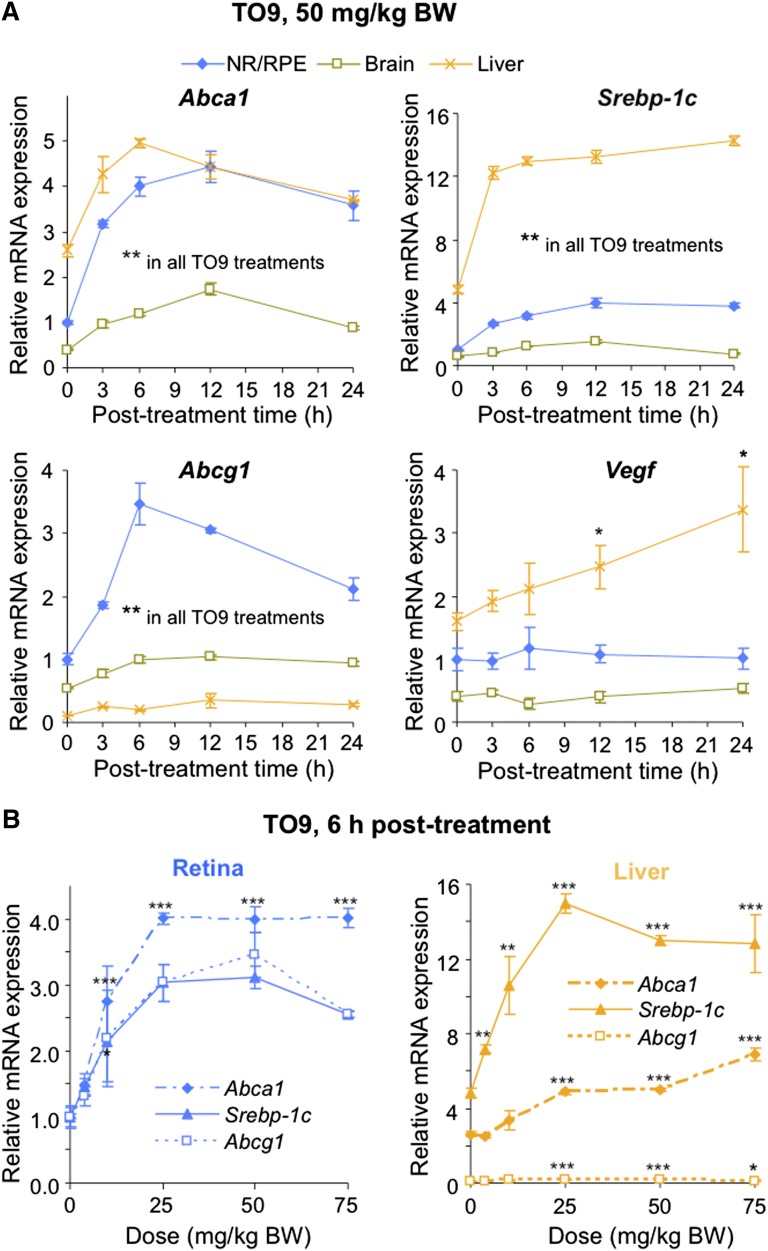
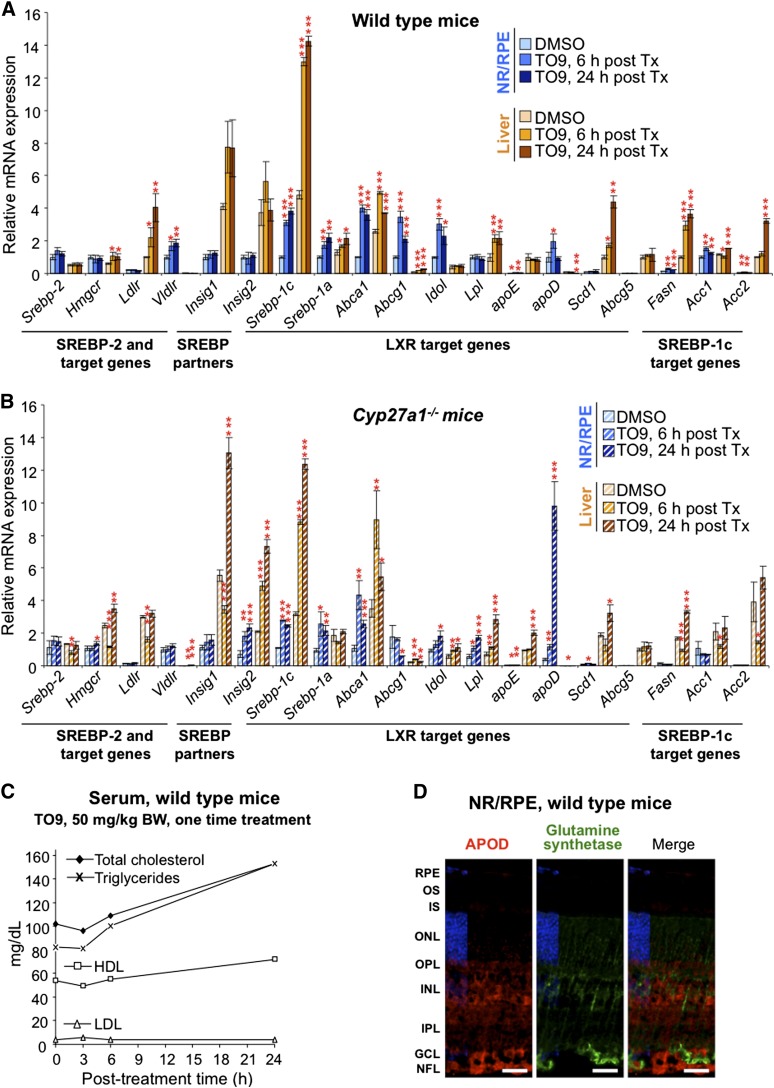
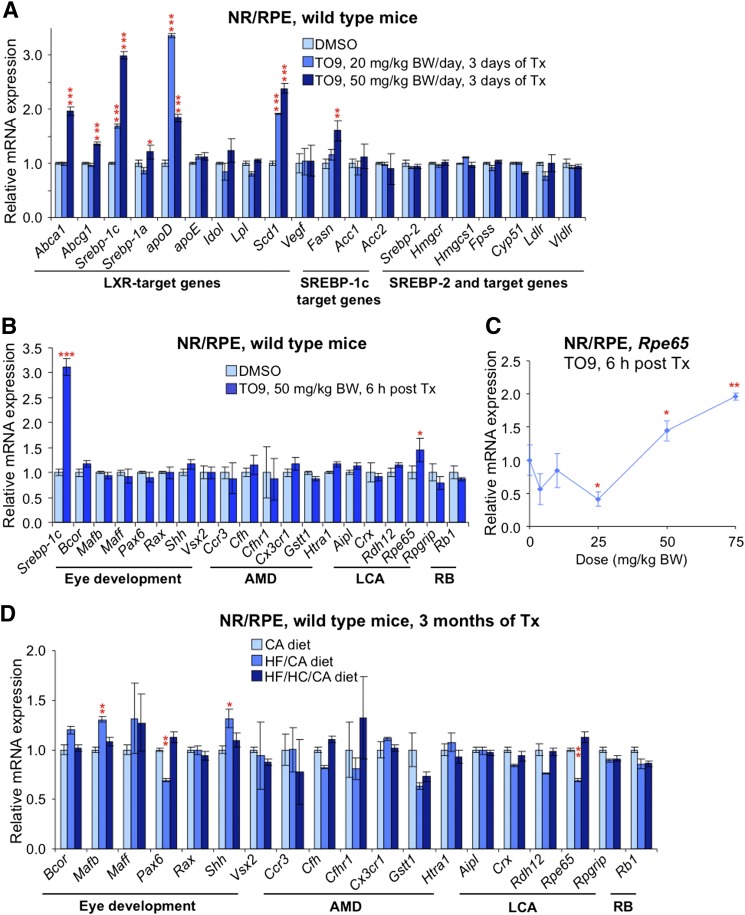
Effects of serum cholesterol on cholesterol content in the retina are currently unknown. It is also unclear how cholesterol levels are controlled in the retina. High-cholesterol diet and oral administrations of simvastatin were used to modulate serum cholesterol in mice. These treatments only modestly affected cholesterol content in the retina and had no significant effect on retinal expression of the major cholesterol- and vision-related genes; the sterol-regulatory element binding protein pathway of transcriptional regulation does not seem to be operative in the retina under the experimental conditions used. Evidence is obtained that posttranslational mechanisms play a role in the control of retinal cholesterol. Retinal genes were only upregulated by oral administrations of TO901317 activating liver X receptors. Three of the upregulated genes could be of particular importance (apoD, Idol, and Rpe65) and have not yet been considered in the context of cholesterol homeostasis in the retina. Collectively, the data obtained identify specific features of retinal cholesterol maintenance and suggest additional therapies for age-related macular degeneration, a blinding disease characterized by cholesterol and lipid accumulations in chorioretinal tissues.

Keywords: 3-hydroxy-3-methyl-glutaryl-CoA reductase; RPE65; age-related macular degeneration; cytochrome P450; liver X receptor; posttranslational regulation; sterol-regulatory element binding protein; transcriptional regulation.


Figures

Fig. 1.
Fig. 1.
Cholesterol and retina essentials. A: Pathways of cholesterol input and output showing some of the proteins whose genes were investigated in the present work. SREBP-1a is a potent activator of all SREBP-responsive genes, whereas SREBP-1c preferentially acts on genes in the pathway of fatty acid synthesis. SREBP-2 preferentially enhances cholesterologenic genes. 22ROH, 22(R)-hydroxycholesterol, the product of CYP11A1; 27OH/COOH, 27-hydroxycholesterol and 5-cholestenoic acid, respectively, the products of CYP27A1; 24SOH, 24(S)-hydroxycholesterol, the product of CYP46A1. B: Chorioretinal layers and cells. The neurosensory retina has distinct layers (from top to bottom): ILM, inner limiting membrane; NFL, nerve fiber layer (ganglion cell axons); GCL, ganglion cell layer; IPL, inner plexiform layer; INL, inner nuclear layer; OPL, outer plexiform layer (synapses); ONL, outer nuclear layer; ELM, external limiting membrane (junctional complexes); IS, PR inner segments; and OS, PR outer segments. RPE lies outside the neurosensory retina but is considered a part of the retina. BrM, Bruch’s membrane (vessel wall and RPE substratum); ChC, choriocapillaris (capillary bed for RPE and PRs). Non-PR layers of the retina are supplied by the retinal circulation (not shown). The major retinal cell types are ganglion cells (G), diffuse amacrine cells (DA), amacrine cells (Am), Müller cells (M), bipolar cells (B), horizontal cells (H), rods (R), and cones (C). Modified from Zheng et al. (11).
Fig. 2.
Fig. 2.
Retinal expression of cholesterol-related genes in WT mice as assessed by PCR array. Each bar represents the mean of duplicate measurements in a pooled sample of three NR/RPEs from three WT mice 3 to 6 months of age. The Ct number reflects the gene expression level with the lower number corresponding to the higher gene expression. Genes in bold red are those whose expression varies >10-fold between males and females.
Fig. 3.
Fig. 3.
Retinal gene and protein expression of transcriptional regulators of cholesterol homeostasis and some of their targets. A: Genes expressed at comparable levels in the NR/RPE, brain, and liver. B: Genes expressed at significantly different levels. mRNA was quantified by qRT-PCR. Bars represent mean ± SD of duplicate measurements in individual samples from five WT male mice 3 to 6 months of age. The expression of Lxrα and Srebp-1a is relative to that of Lxrβ and Srebp-1c, respectively. In the retina, the Ct numbers for Lxrα and Lxrβ are 26.2 and 24.0, respectively, and those for Srebp-1a and Srebp-1c are 25.6 and 25.1, respectively. Retinal Ct for Actb is 20.4. C: Immunohistochemical localization of protein expression in the retina. All images are representative of stainings in multiple sections from four animals. Scale bars: 15 μm.
Fig. 4.
Fig. 4.
Effect of different diets on sterol content in the retina and liver of WT and Cyp27a1−/− (KO) mice. A: The content of total cholesterol including the measurements in the serum. B: The content of cholesterol precursors lanosterol, desmosterol, and lathosterol. Dietary treatments of female mice started after their weaning (about 2 weeks of age) and continued for 3 months; n = 7 per dietary group. Bars pertaining to the NR/RPE are in bluish colors, and those pertaining to the liver and serum are in yellow-brown and magenta-purple colors, respectively. The results are mean ± SD of the measurements in individual animals. CHO, cholesterol; ND, not detectable (the limit of detection is ≥10 pmol/mg protein). Green asterisks are significant changes versus regular chow. Red asterisks are significant changes versus the CA-containing diet. * P < 0.05; ** P < 0.01; *** P < 0.001.
Fig. 5.
Fig. 5.
Effect of different diets on gene expression in the retina and liver of WT (A) and Cyp27a1−/− (B) mice. The dietary treatments, mouse gender, bar color, code, and abbreviations are as in Fig. 4. mRNA was measured by qRT-PCR. Bars represent mean ± SD of individual measurements in five mice. Green asterisks are significant changes versus regular chow. Red asterisks are significant changes versus the CA-containing diet. * P < 0.05; ** P < 0.01; *** P < 0.001.
Fig. 6.
Fig. 6.
Gene (A) and protein (B–E) expression of SREBPs and HMGCR in the retina or liver of mice on regular chow. A: Relative mRNA expression as assessed by qRT-PCR. Bars represent mean ± SD of individual measurements in five mice. B–D: protein detection by Western blot. Retinal lysates (B and C) or microsomes (D) were individually prepared from the four different samples (WT1, WT2, KO1, and KO2), each representing a pooled sample of the NR/RPE or liver from 5 mice, a total of 10 mice per genotype. Black arrow in D corresponds to the molecular weight of HMGCR. E: The quantification of HMGCR expression in D. Results are the mean of the signal intensity of the two WT samples (WT1 and WT2) and two KO (Cyp27a1−/−, KO1 and KO2) samples. Male mice 3 to 6 months of age were used in all experiments.
Fig. 7.
Fig. 7.
Effects of the simvastatin treatment on sterol content (A) and gene expression (B) in mouse retina and liver. Male mice 3 to 6 months of age were euthanized 24 h after the administration of the last drug dose. Bars represent mean ± SD of individual measurements in six mice. The measurements, bar color code, and abbreviations are as in Fig. 4. Red asterisks are significant changes versus control mice that received the vehicle (DMSO). * P < 0.05. Tx, treatment.
Fig. 8.
Fig. 8.
Time course (A) and TO901307 (TO9) dose dependence (B) of retinal and hepatic expression of some of the LXR target genes. Each point represents mean ± SD of individual measurements in five retinas or livers from five male mice 3 to 6 months of age. Black asterisks are significant changes versus control animals that received the vehicle (DMSO). * P < 0.05; ** P < 0.01; *** P < 0.001.
Fig. 9.
Fig. 9.
Effect of TO9 treatment on gene expression in mouse retina and liver (A and B) and lipid profile in the serum (C). A–C: A single dose of TO9 (50 mg/kg BW) was administered by gavage to male mice 3 to 6 months of age, and animals were euthanized at the indicated time. The bar color code is as in Fig. 4. Bars represent mean ± SD of individual measurements in five retinas or livers from five mice. * P < 0.05; ** P < 0.01; *** P < 0.001 compared with animals that received the vehicle (DMSO). The data on the serum lipid content represent single measurements in a pooled sample from three mice. D: Immunohistochemical localization of APOD (in red) and glutamine synthetase (in green, a marker for Müller cells) in mouse retina. All images are representative of stainings in multiple sections from four male mice 3 to 6 months of age. Scale bars: 15 μm.
Fig. 10.
Fig. 10.
Effects of TO9 (A–C) and dietary (D) treatments on gene expression in mouse retina. A: A single dose of TO9 (either 20 mg/kg BW or 50 mg/kg BW) was administered by gavage to mice for 3 consecutive days, and animals were euthanized 24 h after the last treatment. B: Onetime TO9 administration. Animals were euthanized 6 h post treatment (Tx). C: Response of retinal Rpe65 expression to varied doses of TO9. Mice were euthanized 6 h after the Tx. D: Effect of diets (see Fig. 4 for details of the dietary treatments) on vision-related genes. Male mice 3 to 6 months of age were used in A–C, and female mice 3 to 6 months of age were used in D. LCA, Leber’s congenital amaurosis; RB, retinoblastoma. All data represent mean ± SD of individual measurements in five retinas from five mice. Red asterisks are significant changes versus control mice that received the vehicle (A–C) or versus mice on the CA-containing diet (D). * P < 0.05; ** P < 0.01; *** P < 0.001.

Comment in

References

    1. Brown M. S., Goldstein J. L. 2009. Cholesterol feedback: from Schoenheimer’s bottle to Scap’s MELADL. J. Lipid Res. 50 (Suppl.): S15–S27. - PMC - PubMed
    1. Horton J. D., Goldstein J. L., Brown M. S. 2002. SREBPs: activators of the complete program of cholesterol and fatty acid synthesis in the liver. J. Clin. Invest. 109: 1125–1131. - PMC - PubMed
    1. Repa J. J., Mangelsdorf D. J. 2000. The role of orphan nuclear receptors in the regulation of cholesterol homeostasis. Annu. Rev. Cell Dev. Biol. 16: 459–481. - PubMed
    1. Yang C., McDonald J. G., Patel A., Zhang Y., Umetani M., Xu F., Westover E. J., Covey D. F., Mangelsdorf D. J., Cohen J. C., et al. 2006. Sterol intermediates from cholesterol biosynthetic pathway as liver X receptor ligands. J. Biol. Chem. 281: 27816–27826. - PubMed
    1. Spann N. J., Garmire L. X., McDonald J. G., Myers D. S., Milne S. B., Shibata N., Reichart D., Fox J. N., Shaked I., Heudobler D., et al. 2012. Regulated accumulation of desmosterol integrates macrophage lipid metabolism and inflammatory responses. Cell. 151: 138–152. - PMC - PubMed

Publication types