. 2014 Nov 20;124(22):3320-8.
doi: 10.1182/blood-2014-05-576017. Epub 2014 Oct 7.

CD4+ invariant natural killer T cells protect from murine GVHD lethality through expansion of donor CD4+CD25+FoxP3+ regulatory T cells

Affiliations

CD4+ invariant natural killer T cells protect from murine GVHD lethality through expansion of donor CD4+CD25+FoxP3+ regulatory T cells

Dominik Schneidawind et al. Blood. .

Abstract

Dysregulated donor T cells lead to destruction of host tissues resulting in graft-versus-host disease (GVHD) after allogeneic hematopoietic cell transplantation (HCT). We investigated the impact of highly purified (>95%) donor CD4(+) invariant natural killer T (iNKT) cells on GVHD in a murine model of allogeneic HCT. We found that low doses of adoptively transferred donor CD4(+) iNKT cells protect from GVHD morbidity and mortality through an expansion of donor CD4(+)CD25(+)FoxP3(+) regulatory T cells (Tregs). These Tregs express high levels of the Ikaros transcription factor Helios and expand from the Treg pool of the donor graft. Furthermore, CD4(+) iNKT cells preserve T-cell-mediated graft-versus-tumor effects. Our studies reveal new aspects of the cellular interplay between iNKT cells and Tregs in the context of tolerance induction after allogeneic HCT and set the stage for clinical translation.


Figures

Figure 1
Figure 1
Purified and adoptively transferred CD4+ iNKT cells protect from GVHD in a dose-dependent manner. (A) Magnetic-activated cell sorting (MACS) followed by fluorescence-activated cell sorting (FACS) of CD4+ iNKT cells. Shaded histogram curves depict CD4 isotype control. (B) Survival, (C) weight, and (D) GVHD score of BALB/c mice co-injected with 5.0 × 10⁶ TCD-BM cells, 1.0 × 10⁶ Tcons, and increasing doses of CD4+ iNKT cells (▲ 1.0 × 10⁴; ● 2.5 × 10⁴; ♦ 5.0 × 10⁴; ▪ 1.0 × 10⁵ per mouse) isolated from C57BL/6 donor mice. Shown are 5 animals per group from 1 of 2 independent experiments. (E) Representative photomicrographs of hematoxylin and eosin–stained sections of haired skin (×200 magnification; scale bar = 100 μ; inset ×400 magnification) and large intestines (×400 magnification; scale bar = 50 μ). The haired skin in all mice on day +10 appears essentially normal except for atrophy of subcutaneous adipose tissues (solid asterisk) in the Tcons and CD4+ iNKT groups (compared with normal adipose tissues in the bone marrow control group [open asterisk]). By day +35, the haired skin remained normal (bone marrow group) or reverted to normal (CD4+ iNKT group), but there were significant lesions in the Tcon group, with the presence of marked epidermal hyperplasia, continued atrophy of subcutaneous adipose tissues (solid asterisk), loss of hair follicles, and presence of moderate numbers of observable apoptotic keratinocytes in the stratum basale (arrows). On higher magnification (inset), these apoptotic keratinocytes appear as shrunken, hypereosinophilic (deep red) round bodies with pyknotic nuclei. The large intestines in both the bone marrow and CD4+ iNKT group appear essentially normal on days +10 and +35, except for the presence of rare apoptotic enterocytes (arrows), which appear as shrunken, hypereosinophilic (deep red) round bodies with pyknotic nuclei. In contrast, in the Tcon group, there was already development of mild lymphocytic colitis on day +10 characterized by small numbers of lymphocytes in the lamina propria (solid asterisks) that caused mild separation of intestinal glands, which themselves displayed mild loss of goblet cells with replacement by undifferentiated, proliferative basophilic (deep blue-purple) crypt enterocytes. Note the presence of small numbers of apoptotic enterocytes (arrows) as well. By day +35, the large intestinal lesions had worsened in the Tcon mice, with larger numbers of lymphocytes in the lamina propria (solid asterisks), larger separation of intestinal glands, marked loss of goblet cells with replacement undifferentiated crypt enterocytes, and larger numbers of apoptotic enterocytes (arrows). Histopathologic findings in recipient livers were mild, and only minor differences between groups were observed (not shown). †Indicates all animals from the respective group died or needed to be euthanized. Error bars indicate standard error of the mean. BM, bone marrow (control group); BMT, bone marrow transplantation.
Figure 2
Figure 2
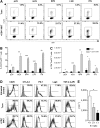
CD4+ iNKT cells inhibit proliferation and activation of alloreactive T cells. (A) Representative bioluminescence images during GVHD initiation (day +5, upper row) and affection of GVHD target sites (day +22, lower row). Bioluminescence signal derived from luc+ Tcons injected on day 0. (B) Bioluminescence signals throughout the experiment. Shown are 5 animals per group from 1 of 2 independent experiments. (C) Graphs depict the percentage of proliferating Thy1.1+ T cells from different secondary lymphoid organs on day +3 as measured by CFSE proliferation assay. Shown is 1 of 3 independent experiments performed in triplicate. (D) Absolute number of live Thy1.1+CD44high T cells re-isolated from BALB/c recipient animals on day +6. Shown is 1 of 2 independent experiments performed in triplicate. (E) Expression of CD25 on live Thy1.1+CD44high T cells. Gates were set on isotype controls. One representative example per group of 3 mice from 1 of 3 independent experiments is shown. †Indicates all animals from the respective group died or needed to be euthanized. Error bars indicate standard error of the mean. LVR, liver; mLN, mesenteric lymph nodes; pLN, peripheral lymph nodes; SPN, spleen. *P ≤ .05; **P ≤ .01; ***P ≤ .001.
Figure 3
Figure 3
CD4+ iNKT cells promote a Th2-biased cytokine response in vivo. (A) mIFN-γ and mIL-5 staining of live Thy1.1+FoxP3CD4+ T cells. Gates were set on isotype controls. Shown are representative dot plots from 1 of 2 independent experiments. (B) Serum levels of cytokines in the presence of Tcon or Tcon + CD4+ iNKT cells. Shown are 3 animals per group from 1 of 3 independent experiments. Error bars indicate standard error of the mean. mTNF-α, murine tumor necrosis factor α. *P ≤ .05; **P ≤ .01.
Figure 4
Figure 4
CD4+ iNKT cells promote an expansion of donor Tregs. (A) FoxP3 expression of live Thy1.1+CD4+ T cells. Gates are set on isotype controls. Shown are representative dot plots from 1 of at least 5 independent experiments. (B) Relative (percentage of live Thy1.1+CD4+) and (C) absolute cell numbers of FoxP3-expressing donor CD4+ T cells. Shown are 3 animals per group from 1 of at least 5 independent experiments. (D) Expression of CD25, cytotoxic T-lymphocyte antigen 4 (CTLA-4), programmed cell death protein 1 (PD-1), lymphocyte-activation gene 3 (Lag3), and transforming growth factor β (latency-associated peptide) (TGF-β [LAP]) on live Thy1.1+CD4+FoxP3+ T cells. Shaded curves depict isotype controls. Shown are pooled data of 3 mice from 1 of at least 2 independent experiments. (E) Mixed lymphocyte reaction (MLR) of donor Thy1.1+ Tregs pooled and sorted from BALB/c mice, donor Tcon effectors, and irradiated allogeneic BALB/c stimulators. The MLR was performed in triplicate. Shown is 1 of 3 independent experiments. Error bars indicate standard error of the mean. E, effector (Tcon); I, inhibitor (Thy1.1+ Treg); ITN, intestine. *P ≤ .05; **P ≤ .01; ***P ≤ .001.
Figure 5
Figure 5
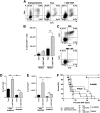
Tregs expand from the Tcon inoculum and are required for protection from GVHD. (A) Expression of FoxP3 and Helios in live splenic Thy1.1+CD4+ T cells. Shown are representative dot plots from 1 of 3 independent experiments. (B) Total numbers of live splenic HeliosFoxP3+ and Helios+FoxP3+ Thy1.1+CD4+ T cells. Shown is 1 of 3 independent experiments. (C) Expression of CD25 and FoxP3 in live CD4+ T cells after intraperitoneal injection of 50 µg⋅kg−1 diphtheria toxin (DT) into FoxP3DTR C57BL/6 donor mice on 2 consecutive days. Shown are representative dot plots from 1 of 2 independent experiments. (D) Relative and (E) absolute numbers of donor Thy1.1+ Tregs re-isolated from BALB/c recipient mice that received either Treg-nondepleted (left bars) or Treg-depleted grafts (right bars), respectively. Population gated on live Thy1.1+CD4+ T cells. Shown are 3 animals per group from 1 of 2 independent experiments. (F) Pooled survival data from 2 independent experiments of BALB/c mice treated with CD4+ iNKT cells in the presence and absence of donor Tregs. Ten animals per group except irradiation control (n = 6). Error bars indicate standard error of the mean. *P ≤ .05; **P ≤ .01.
Figure 6
Figure 6
CD4+ iNKT cells preserve Tcon-mediated GVT reactions against A20 lymphoma cells. (A) Tumor growth of luc+ A20 cells was assessed by BLI. Shown are representative bioluminescence images of day +16. (B) Bioluminescence signal intensity and (C) survival of BALB/c mice throughout the whole experiment. Shown is 1 of 2 independent experiments with 5 animals per group except irradiation control (n = 3). †Indicates all animals from the respective group died or needed to be euthanized. Error bars indicate standard error of the mean.

References

    1. Ferrara JL, Deeg HJ. Graft-versus-host disease. N Engl J Med. 1991;324(10):667–674. - PubMed
    1. Edinger M, Hoffmann P, Ermann J, et al. CD4+CD25+ regulatory T cells preserve graft-versus-tumor activity while inhibiting graft-versus-host disease after bone marrow transplantation. Nat Med. 2003;9(9):1144–1150. - PubMed
    1. Di Ianni M, Falzetti F, Carotti A, et al. Tregs prevent GVHD and promote immune reconstitution in HLA-haploidentical transplantation. Blood. 2011;117(14):3921–3928. - PubMed
    1. Brunstein CG, Miller JS, Cao Q, et al. Infusion of ex vivo expanded T regulatory cells in adults transplanted with umbilical cord blood: safety profile and detection kinetics. Blood. 2011;117(3):1061–1070. - PMC - PubMed
    1. Schneidawind D, Pierini A, Negrin RS. Regulatory T cells and natural killer T cells for modulation of GVHD following allogeneic hematopoietic cell transplantation. Blood. 2013;122(18):3116–3121. - PMC - PubMed

Publication types

MeSH terms

Substances