. 2014 Dec;24(12):2011-21.
doi: 10.1101/gr.175893.114. Epub 2014 Oct 7.

Accounting for biases in riboprofiling data indicates a major role for proline in stalling translation

Affiliations

Accounting for biases in riboprofiling data indicates a major role for proline in stalling translation

Carlo G Artieri et al. Genome Res. 2014 Dec.

Abstract

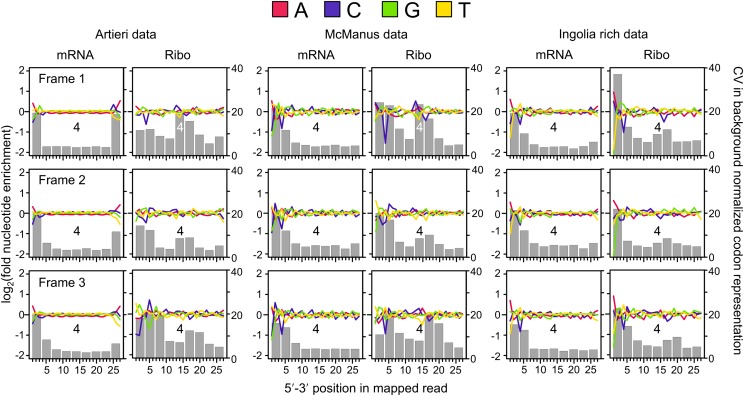
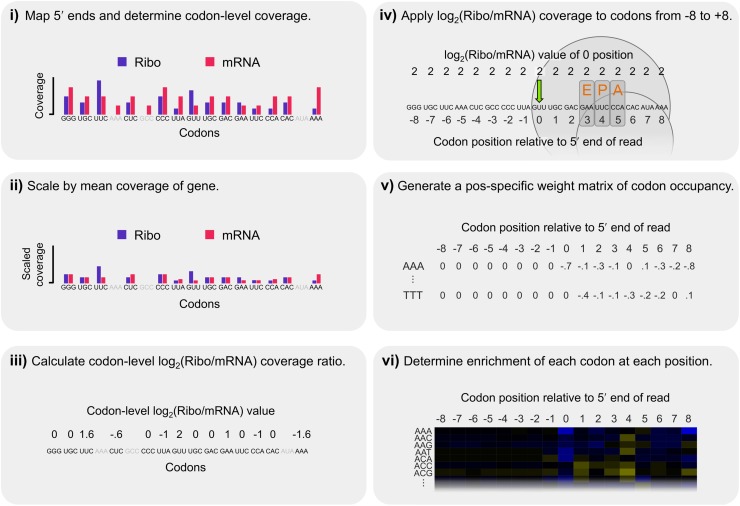
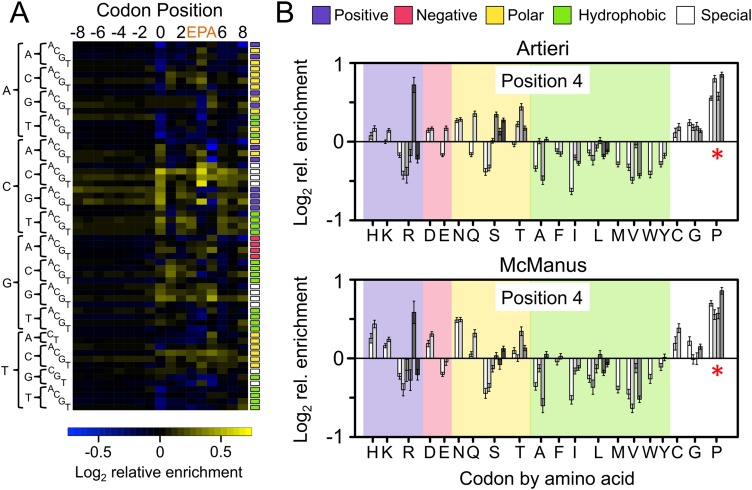
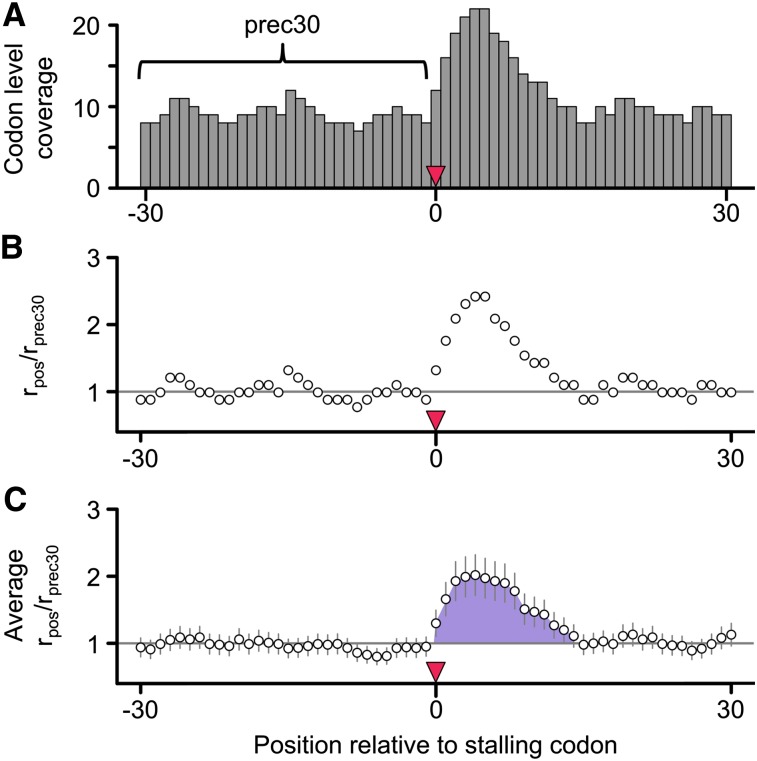
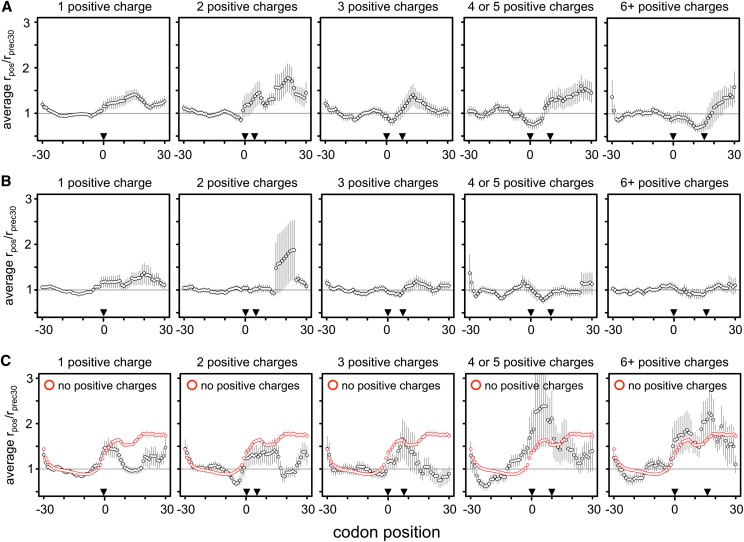
The recent advent of ribosome profiling-sequencing of short ribosome-bound fragments of mRNA-has offered an unprecedented opportunity to interrogate the sequence features responsible for modulating translational rates. Nevertheless, numerous analyses of the first riboprofiling data set have produced equivocal and often incompatible results. Here we analyze three independent yeast riboprofiling data sets, including two with much higher coverage than previously available, and find that all three show substantial technical sequence biases that confound interpretations of ribosomal occupancy. After accounting for these biases, we find no effect of previously implicated factors on ribosomal pausing. Rather, we find that incorporation of proline, whose unique side-chain stalls peptide synthesis in vitro, also slows the ribosome in vivo. We also reanalyze a method that implicated positively charged amino acids as the major determinant of ribosomal stalling and demonstrate that it produces false signals of stalling in low-coverage data. Our results suggest that any analysis of riboprofiling data should account for sequencing biases and sparse coverage. To this end, we establish a robust methodology that enables analysis of ribosome profiling data without prior assumptions regarding which positions spanned by the ribosome cause stalling.


Figures

Figure 1.
Figure 1.
Defining positions relative to the 5′ end of riboprofiling reads. Following the mapping approach of Ingolia (2010), ribosomes (large and small subunits represented by gray circles) protect at least 27 nt of mRNA, corresponding to at least nine codons. Nucleotides and in-frame codons were counted from 5′ to 3′ as shown (arbitrary codons are indicated in alternating blue and red for clarity). In the figure, the ribosome-protected fragment begins in the first reading frame within a codon. However, for reads mapping to the second or third reading frames, while nucleotide counting begins at the first nucleotide, codon counting remains in-frame with the first codon, 0, corresponding to the one containing the first nucleotide. For reference, the orange letters indicate the codons that previous studies have indicated as the exit-tRNA (E-site), the peptidyl-tRNA (P-site), and aminoacyl-tRNA (A-site) sites, respectively (Ingolia et al. 2009; Stadler and Fire 2011; Li et al. 2012; Qian et al. 2012; Zinshteyn and Gilbert 2013).
Figure 2.
Figure 2.
Patterns of nucleotide and codon representation across the three data sets. Reads were separated into those whose 5′ ends map to the first, second, or third reading frame within codons (frame 1, 2, or 3). The fold enrichment of each nucleotide was determined by dividing its number of counts at each position by the mean number of counts at positions within the same reading frame across the 27 nucleotides analyzed, thereby accounting for differences in expected nucleotide proportions among reading frames within codons. Enrichment is plotted in log2 scale: red, adenine; blue, cytosine; green, guanine; and yellow, thymine. Each codon position overlapped by each read was also determined by identifying the nine consecutive codons beginning from the 5′ end, as indicated in Figure 1. The gray bars indicate the coefficient of variation (CV) as a measure of the degree to which each position deviates from the expected background frequency of the 61 sense codons; codon position 4 is indicated for reference.
Figure 3.
Figure 3.
Steps in our calculation of corrected Ribo coverage. We analyzed Ribo fraction reads in a position-specific manner that controlled for shared biases between the two fractions while making no a priori assumptions about which codon position(s) may be most important in explaining patterns of coverage. (i) The 5′ ends of reads were mapped and codon-level coverage determined from each fraction separately. Only sites with data from both fractions were considered (excluded codons are indicated in gray). (ii) To account for coverage differences among genes, codon-level coverage values were scaled by the mean codon-level coverage of analyzed codons within each gene. (iii) These scaled values were used to calculate a log2(Ribo/mRNA) coverage ratio for each codon, thereby accounting for shared biases between the two fractions. (iv) Because increased coverage at the 5′ position of ribosome-protected fragments could be driven by sequence factors upstream or downstream, the log2(Ribo/mRNA) coverage at position 0 (green arrow) was recorded for all codons from −8 to +8 relative to the 5′ end for each analyzed site. The expected position of the ribosome is indicated for reference. (v) We repeated this across all analyzed codons in the transcriptome, generating a distribution for each of the 61 nonstop codons at each of the 17 positions, representing its position-specific relative contribution to ribosomal occupancy. (vi) Finally, the relative enrichment of each codon at each position was determined by scaling its mean log2(Ribo/mRNA) coverage value by the mean value of all 61 sense codons at that position, such that codons with positive log2 values were enriched relative to expectations and those with negative values were depleted (as plotted as in Fig. 4A).
Figure 4.
Figure 4.
The corrected Ribo coverage reveals a strong enrichment of proline codons. (A) Heatmap of the mean-scaled log2 enrichment of codon positions −8 to 8 in the Artieri data (the McManus data are similar) (Supplemental Fig. S9). All 61 sense codons are shown in alphabetical order indicated by their sequences on the left. Enriched codons are indicated by an increasing intensity of yellow color, while depleted codons are blue. Colored boxes to the right of each row indicate the biochemical category to which the codon belongs (color key is at the top of panel B). Codons associated with the E, P, and A active sites of the ribosome (positions 3, 4, and 5, respectively) are indicated. (B) Bar plots indicating the log2 enrichment values at position 4 of both the Artieri and McManus data sets. Codons are organized by amino acid using single-letter designations below the panel and grouped by biochemical type as indicated at the top of the panel. Individual codons for each amino acid are in alphabetical order. The 95% confidence intervals around the scaled enrichment values are indicated at the top of each bar. The asterisks indicate that proline (P) codons are more enriched than any other amino acid (Kruskal-Wallis rank sum test, P < 10−15).
Figure 5.
Figure 5.
The rpos/rprec30 method of Charneski and Hurst. (A) As a measure of the stalling effect of a codon (or group of codons beginning) at position 0, the occupancy of all codon positions (rpos) from 30 codons upstream (position −30) to 30 codons downstream (position 30) of the putative stalling codon was divided by the mean occupancy of upstream codons −30 to −1 (rprec30, indicated by the bracket). (B) This produced a normalized pausing value (rpos/rprec30), where a value of one represents the average rate of translation. (C) After averaging the rpos/rprec30 values among all similar groups of codons, the AUC (indicated by the shaded purple area) of the mean-normalized occupancy values from position 0 until the position where mean occupancy returned to the average was used as a measure of the stalling effect (if positive).
Figure 6.
Figure 6.
No evidence of stalling at positive amino acids. We recalculated Charneski and Hurst’s (2013) Figure 5 using either the Artieri (A) or the McManus (B) data. Following the published approach, clusters of increasing numbers of positive amino acid encoding codons were identified within the range bounded by pairs of inverted triangles. The horizontal gray line indicates the average rate of translation. Error bars, ±SEM. No additive effect is observed in either high-coverage data set, in contrast to the Ingolia data (Supplemental Fig. S27); the AUCs for one, two, three, four or five, and six or more positive charge clusters were 7.89, 12.83, −0.71, −1.36, and −2.75 for the Artieri data, and 6.46, 0.08, −0.59, 0.04, and 0.09 for the McManus data, respectively. (C) The data from Charneski and Hurst’s (2013) Figure 5 (black) compared to the mean rpos/rprec30 generated from 100 random samplings of 61-codon windows devoid of any positive amino acid encoding codons (red). The average stalling pattern of windows lacking any positive charges is stronger than that observed in any of the clusters (Kruskal-Wallis rank sum test of distributions’ AUC values, P < 10−15 for all clusters except for six or more positive charges, where P = 0.02 after Bonferroni correction for multiple tests). Therefore the observed stalling effect of positive amino acids is not greater than what would be expected by chance within the Ingolia data.

Similar articles

Cited by

References

    1. Andersson SG, Kurland CG. 1990. Codon preferences in free-living microorganisms. Microbiol Rev 54: 198–210. - PMC - PubMed
    1. Artieri CG, Fraser HB. 2014. Evolution at two levels of gene expression in yeast. Genome Res 24: 411–421. - PMC - PubMed
    1. Bazzini AA, Johnstone TG, Christiano R, Mackowiak SD, Obermayer B, Fleming ES, Vejnar CE, Lee MT, Rajewsky N, Walther TC, et al. . 2014. Identification of small ORFs in vertebrates using ribosome footprinting and evolutionary conservation. EMBO J 33: 981–993. - PMC - PubMed
    1. Bennetzen JL, Hall BD. 1982. Codon selection in yeast. J Biol Chem 257: 3026–3031. - PubMed
    1. Brar GA, Yassour M, Friedman N, Regev A, Ingolia NT, Weissman JS.. 2012. High-resolution view of the yeast meiotic program revealed by ribosome profiling. Science 335: 552–557. - PMC - PubMed

Publication types