

Social determinants of health in India: progress and inequities across states
- PMID: 25294304
- PMCID: PMC4201685
- DOI: 10.1186/s12939-014-0088-0
Social determinants of health in India: progress and inequities across states
Abstract
Introduction: Despite the recognized importance of social determinants of health (SDH) in India, no compilation of the status of and inequities in SDH across India has been published. To address this gap, we assessed the levels and trends in major SDH in India from 1990 onwards and explored inequities by state, gender, caste, and urbanicity.
Methods: Household- and individual-level SDH indicators were extracted from national household surveys conducted between 1990 and 2011 and means were computed across population subgroups and over time. The multidimensional poverty index (MPI), a composite measure of health, education, and standard of living, was calculated for all three rounds of the National Family Health Survey, adjusting the methodology to generate comparable findings from the three datasets. Data from government agencies were analyzed to assess voting patterns, political participation, and air and water pollution.
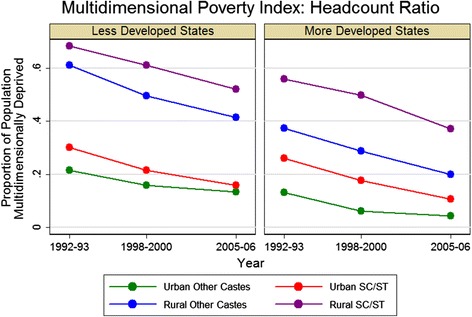
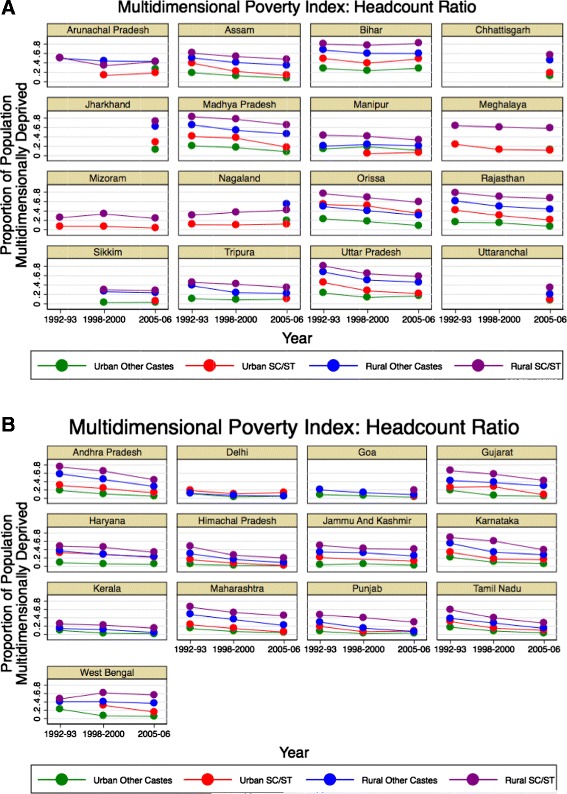
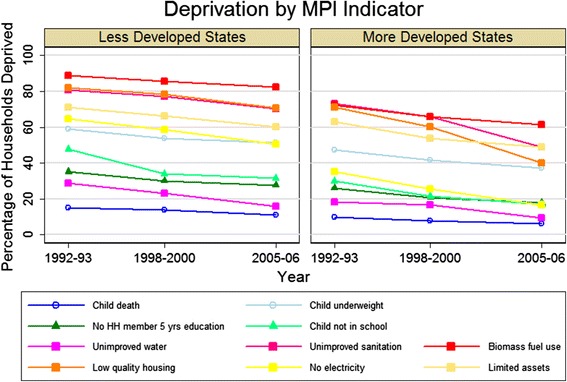
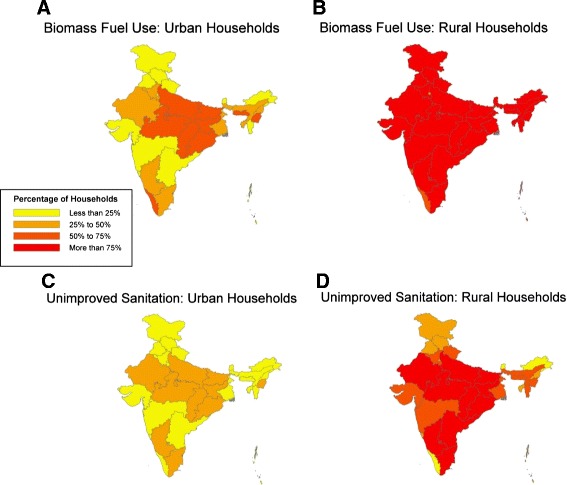
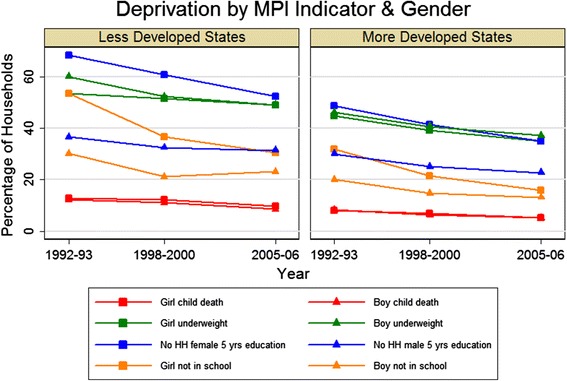
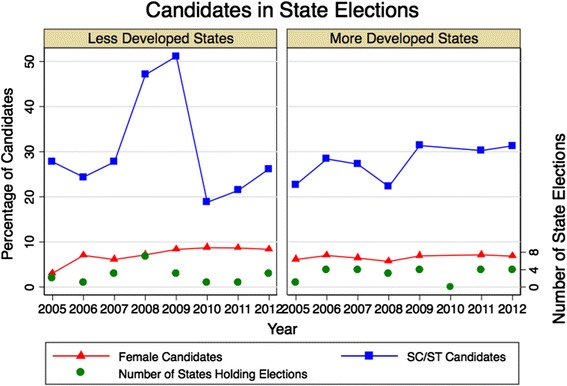
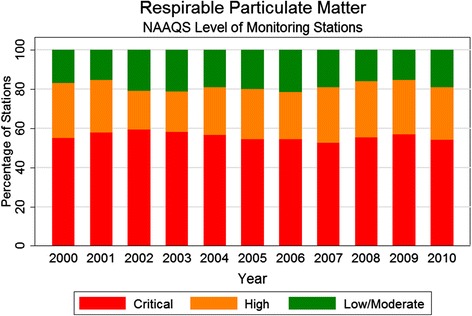
Results: Changes in the MPI demonstrate progress in each domain over time, but high rates persist in important areas: the majority of households in India use indoor biomass fuel and have unimproved sanitation, and over one-third of households with a child under the age of 3 years have undernourished children. There are large, but narrowing, gender gaps in education indicators, but no measurable change in women's participation in governance or the labor force. Less than 25% of workers have job security and fewer than 15% have any social security benefit. Alarming rates of air pollution are observed, with particulate matter concentrations persistently above the critical level at over 50% of monitoring stations.
Conclusions: This assessment indicates that air pollution (indoor and outdoor), child undernutrition, unimproved sanitation, employment conditions, and gender inequality are priority areas for public policy related to SDH in India.
Figures
Similar articles
-
Child health and nutrition in Peru within an antipoverty political agenda: a Countdown to 2015 country case study.Lancet Glob Health. 2016 Jun;4(6):e414-26. doi: 10.1016/S2214-109X(16)00085-1. Lancet Glob Health. 2016. PMID: 27198845
-
Socio-economic inequality in malnutrition among children in India: an analysis of 640 districts from National Family Health Survey (2015-16).Int J Equity Health. 2019 Dec 27;18(1):203. doi: 10.1186/s12939-019-1093-0. Int J Equity Health. 2019. PMID: 31881899 Free PMC article.
-
Geographic and socio-economic variation in markers of indoor air pollution in Nepal: evidence from nationally-representative data.BMC Public Health. 2019 Feb 14;19(1):195. doi: 10.1186/s12889-019-6512-z. BMC Public Health. 2019. PMID: 30764804 Free PMC article.
-
A Scoping Review and Assessment of the Area-Level Composite Measures That Estimate Social Determinants of Health Across the United States.Public Health Rep. 2025 Jan-Feb;140(1):67-102. doi: 10.1177/00333549241252582. Epub 2024 Jun 19. Public Health Rep. 2025. PMID: 39663655 Free PMC article.
-
Social determinants of maternal health: a scoping review of factors influencing maternal mortality and maternal health service use in India.Public Health Rev. 2020 Jun 2;41:13. doi: 10.1186/s40985-020-00125-6. eCollection 2020. Public Health Rev. 2020. PMID: 32514389 Free PMC article.
Cited by
-
Sociodemographic characteristics of women who died by suicide in India from 2014 to 2020: findings from surveillance data.Lancet Public Health. 2023 May;8(5):e347-e355. doi: 10.1016/S2468-2667(23)00028-2. Lancet Public Health. 2023. PMID: 37120259 Free PMC article.
-
Association Between Anthropometric Risk Factors and Metabolic Syndrome Among Adults in India: A Systematic Review and Meta-Analysis of Observational Studies.Prev Chronic Dis. 2022 May 5;19:E24. doi: 10.5888/pcd19.210231. Prev Chronic Dis. 2022. PMID: 35512304 Free PMC article.
-
Does education moderate gender disparities in later-life memory function? A cross-national comparison of harmonized cognitive assessment protocols in the United States and India.Alzheimers Dement. 2024 Jan;20(1):16-24. doi: 10.1002/alz.13404. Epub 2023 Jul 25. Alzheimers Dement. 2024. PMID: 37490296 Free PMC article.
-
Cross-sectional evaluation of the multidimensional indicators of psychosocial functioning and its sociodemographic correlates among Indian adults: WHO SAGE Study (2007-2010).PLOS Glob Public Health. 2024 Apr 25;4(4):e0003102. doi: 10.1371/journal.pgph.0003102. eCollection 2024. PLOS Glob Public Health. 2024. PMID: 38662761 Free PMC article.
-
Good education and communication can change the world.J Family Med Prim Care. 2022 Aug;11(8):4896-4897. doi: 10.4103/jfmpc.jfmpc_523_21. Epub 2022 Aug 30. J Family Med Prim Care. 2022. PMID: 36353015 Free PMC article. No abstract available.
References
-
- Commission on Social Determinants of Health . Closing the Gap in a Generation: Health Equity through Action on the Social Determinants of Health. Geneva: World Health Organization; 2008. - PubMed
-
- Cattaneo MD, Galiani S, Gertler PJ, Martinez S, Titiunik R. Housing, health, and happiness. Ame Econ J Econ Pol. 2009;1(1):75–105. doi: 10.1257/pol.1.1.75. - DOI
Publication types
MeSH terms
LinkOut - more resources
Full Text Sources
Other Literature Sources
Medical
Miscellaneous
