. 2014 Nov 25;130(22):1936-1943.
doi: 10.1161/CIRCULATIONAHA.114.011359. Epub 2014 Oct 7.

Electrophysiologic substrate in congenital Long QT syndrome: noninvasive mapping with electrocardiographic imaging (ECGI)

Affiliations

Electrophysiologic substrate in congenital Long QT syndrome: noninvasive mapping with electrocardiographic imaging (ECGI)

Ramya Vijayakumar et al. Circulation. .

Abstract

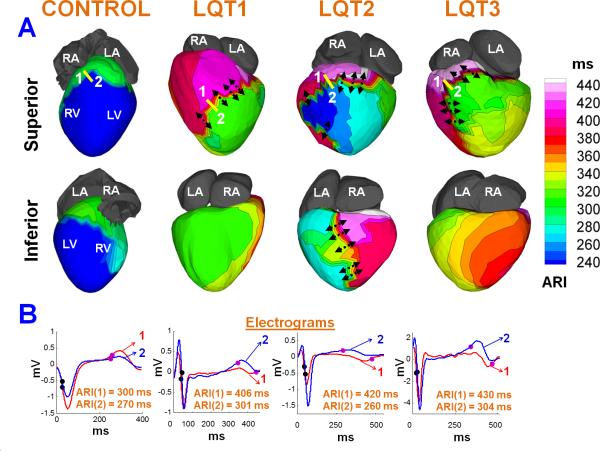
Background: Congenital Long QT syndrome (LQTS) is an arrhythmogenic disorder that causes syncope and sudden death. Although its genetic basis has become well-understood, the mechanisms whereby mutations translate to arrhythmia susceptibility in the in situ human heart have not been fully defined. We used noninvasive ECG imaging to map the cardiac electrophysiological substrate and examine whether LQTS patients display regional heterogeneities in repolarization, a substrate that promotes arrhythmogenesis.

Methods and results: Twenty-five subjects (9 LQT1, 9 LQT2, 5 LQT3, and 2 LQT5) with genotype and phenotype positive LQTS underwent ECG imaging. Seven normal subjects provided control. Epicardial maps of activation, recovery times, activation-recovery intervals, and repolarization dispersion were constructed. Activation was normal in all patients. However, recovery times and activation-recovery intervals were prolonged relative to control, indicating delayed repolarization and abnormally long action potential duration (312±30 ms versus 235±21 ms in control). Activation-recovery interval prolongation was spatially heterogeneous, with repolarization gradients much steeper than control (119±19 ms/cm versus 2.0±2.0 ms/cm). There was variability in steepness and distribution of repolarization gradients between and within LQTS types. Repolarization gradients were steeper in symptomatic patients (130±27 ms/cm in 12 symptomatic patients versus 98±19 ms/cm in 13 asymptomatic patients; P<0.05).

Conclusions: LQTS patients display regions with steep repolarization dispersion caused by localized action potential duration prolongation. This defines a substrate for reentrant arrhythmias, not detectable by surface ECG. Steeper dispersion in symptomatic patients suggests a possible role for ECG imaging in risk stratification.

Keywords: ECG imaging; arrhythmia; electrophysiology; imaging, diagnostic; long-QT syndrome.


Figures

Figure 1
Figure 1
Epicardial Activation Times (AT) Isochrone Maps. Examples of activation in (left to right) control, LQT1 (patient 21), LQT2 (patient 3), and LQT3 (patient 7). In all LQTS types as in normal control, epicardial activation starts from breakthrough at anterior RV (shown by white asterisk) near the RVOT region, 20-30 ms after the onset of QRS. It proceeds in a uniform fashion to activate the ventricles synchronously. The latest region to activate is the LV basal region (dark blue). The total ventricular activation time (TVAT) in all LQTS types was around 50 ms, comparable to normal control. RA = right atrium, LA = left atrium, RV = right ventricle, LV = left ventricle, AO = aorta, ms = milliseconds.
Figure 2
Figure 2
Epicardial Recovery Time (RT) Maps. A. Maps are shown in superior (top row) and inferior (bottom row) views for control, LQT1 (patient 15), LQT2 (patient 16), and LQT3 (patient 8). All three LQTS subjects had regions with abnormally long RT as shown by predominant magenta and white colors in the maps. The maximum RT value in LQTS was 470 ms. The maximum RT value in the normal heart (left most column) was 360 ms (predominant blue and green colors in the map). The heterogeneity in ventricular recovery resulted in large RT differences in all three LQTS types. The solid yellow line (top panels) connects two closest neighboring EGMs (from site 1 and site 2) with maximum ΔRT. In all three LQTS patients, ΔRT (RT(1)-RT(2)) exceeded 100 ms (compared to normal value of only 28 ms in the left most column). As a result, there was a steep gradient of repolarization ΔRT/Δx across this region (shown by black arrows); it was much steeper than control (Normal: 6 ms/cm, LQT1: 102 ms/cm, LQT2: 159 ms/cm, LQT3: 139 ms/cm). B. ECGI-reconstructed unipolar EGMs from the three LQT patients exhibited drastic changes in T-wave morphology across the yellow line. The T waves obtained from site 1 (red) were inverted or predominantly negative compared to those from site 2 (blue; upright or predominantly positive). Such T-wave changes over a short distance (<10 mm) were absent in the control group. RT (time of dV/dt max during upstroke of T wave) is indicated by the pink dot on the corresponding EGMs (site 1 red; site 2 blue). Corresponding 12-lead ECG tracings are provided in Supplemental Figure 1. mV = millivolts.
Figure 3
Figure 3
Activation-Recovery Interval (ARI) Maps. A. Maps are shown in superior (top row) and inferior (bottom row) views for the patients of figure 2. ARI (surrogate for local APD) values were abnormally long (magenta and white regions) in all three LQTS patients compared to control. The maximum ARI value in LQTS was 450 ms compared to only 340 ms (green in the left most column) in control. The localized prolongation of APD resulted in large ARI differences in all three LQTS types. The solid yellow line (top panels) connects two closest neighboring EGMs (from site 1 and site 2) with maximum ΔARIc. In all three LQTS patients, ΔARIc (ARIc(1)-ARIc(2)) exceeded 100 ms (compared to normal ΔARIc of only 30 ms in the left most column). As a result, there was a steep gradient of repolarization ΔARIc/Δx across this region (indicated by black arrows) which was two orders of magnitude greater than control (Normal: 7 ms/cm, LQT1: 104 ms/cm, LQT2: 146 ms/cm, LQT3: 140 ms/cm). B. The ECGI-reconstructed EGMs depict the time instances of AT (black dots) and RT (pink dots). The corresponding ARI values (RT – AT) are indicated below.

Comment in

References

    1. Schwartz PJ, Stramba-Badiale M, Crotti L, Pedrazzini M, Besana A, Bosi G, Gabbarini F, Goulene K, Insolia R, Mannarino S, Mosca F, Nespoli L, Rimini A, Rosatti E, Salice P, Spazzolini C. Prevalence of the congenital long-QT syndrome. Circulation. 2009;120:1761–1767. - PMC - PubMed
    1. Schwartz PJ, Crotti L, Insolia R. Long-QT Syndrome: from genetics to management. Circ Arrhythm Electrophysiol. 2012;5:868–877. - PMC - PubMed
    1. Roden DM, Balser JR, George AL, Anderson ME. Cardiac ion channels. Annu Rev Physiol. 2002;64:431–475. - PubMed
    1. Schwartz PJ, Ackerman MJ, George AL, Wilde AM. Impact of genetics on the clinical management of channelopathies. J Am Coll Cardiol. 2013;62:169–180. - PMC - PubMed
    1. Rautaharju PM, Surawicz B, Gettes LS, Bailey JJ, Childers R, Deal BJ, Gorgels A, Hancock EW, Josephson M, Kligfield P, Kors JA, Macfarlane P, Mason JW, Mirvis DM, Okin P, Pahlm O, van Herpen G, Wagner GS, Wellens H. American Heart Association Electrocardiography and Arrhythmias Committee, Council on Clinical Cardiology; American College of Cardiology Foundation; Heart Rhythm Society. AHA/ACCF/HRS recommendations for the standardization and interpretation of the electrocardiogram: part IV: the ST segment, T and U waves, and the QT interval: a scientific statement from the American Heart Association Electrocardiography and Arrhythmias Committee, Council on Clinical Cardiology; the American College of Cardiology Foundation; and the Heart Rhythm Society: endorsed by the International Society for Computerized Electrocardiology. J Am Coll Cardiol. 2009;53:982–991. - PubMed

Publication types

LinkOut - more resources