. 2014 Oct 15;5(19):9425-43.
doi: 10.18632/oncotarget.2444.

Epigenetic signatures of alcohol abuse and hepatitis infection during human hepatocarcinogenesis

Affiliations

Epigenetic signatures of alcohol abuse and hepatitis infection during human hepatocarcinogenesis

Ryan A Hlady et al. Oncotarget. .

Abstract

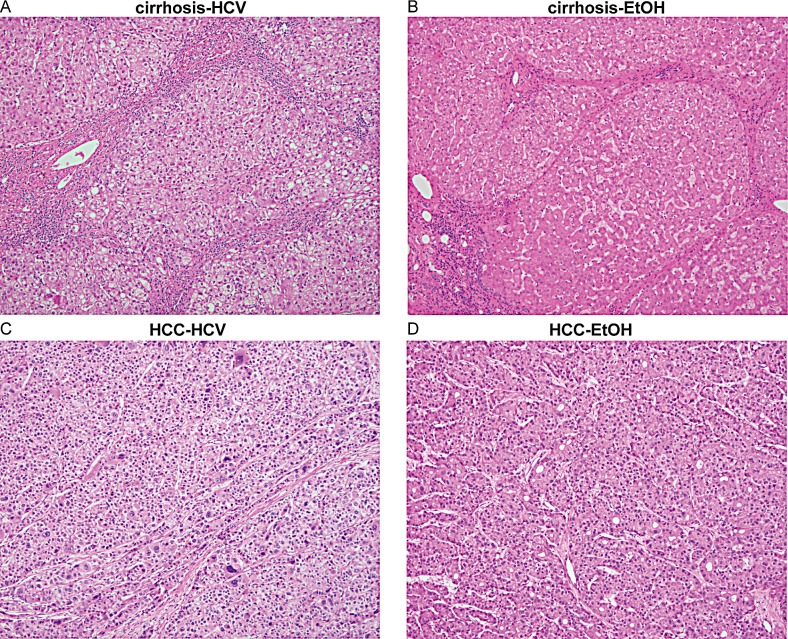
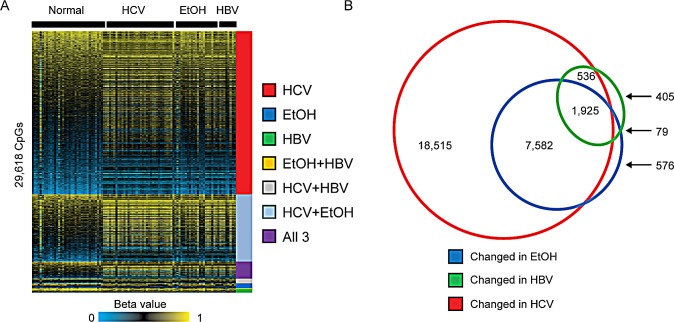
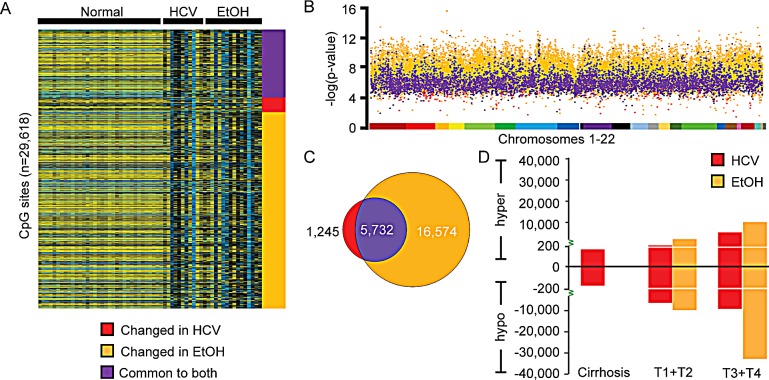
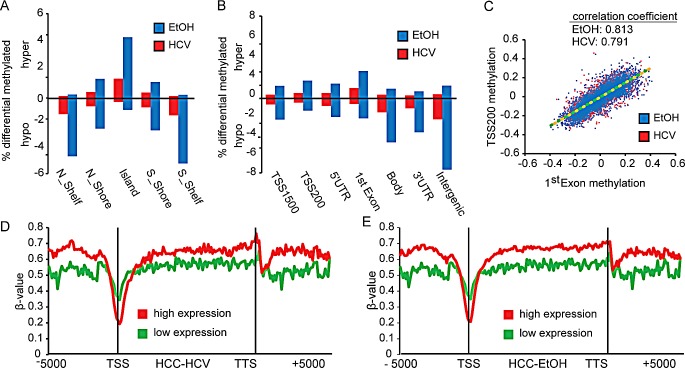
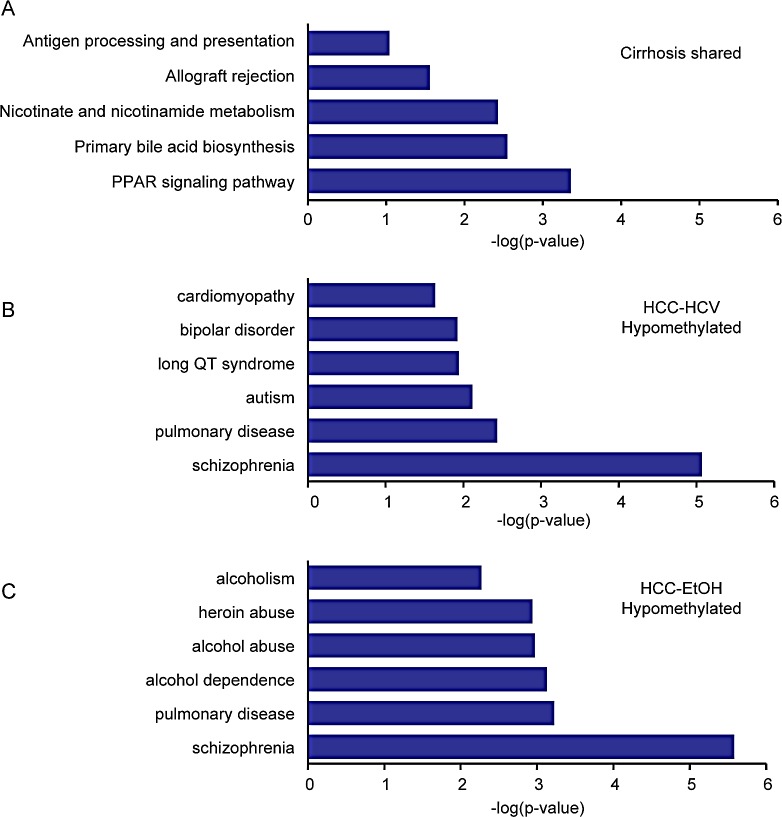
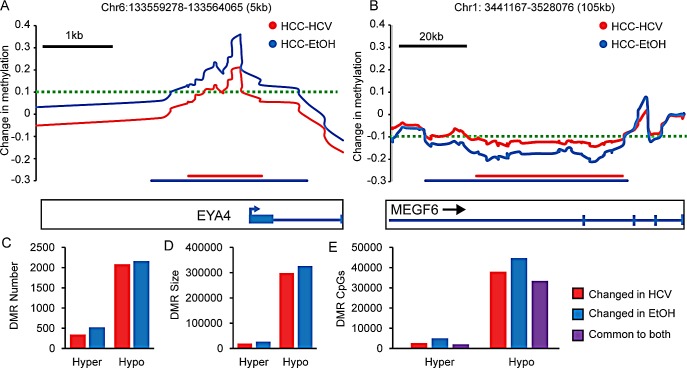
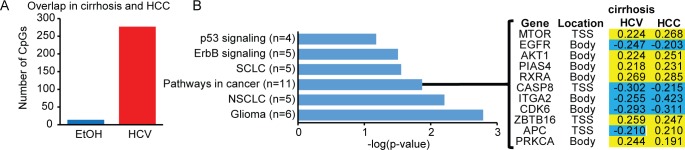
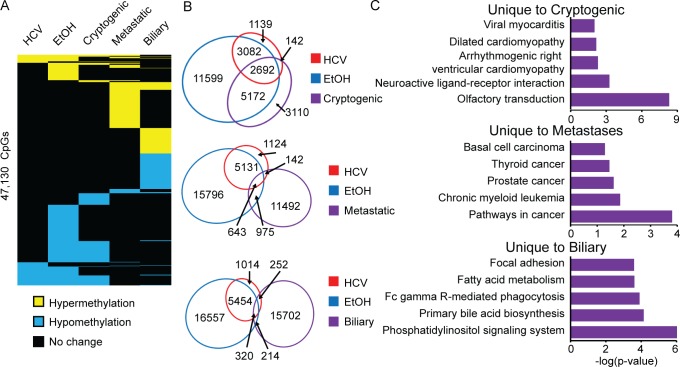
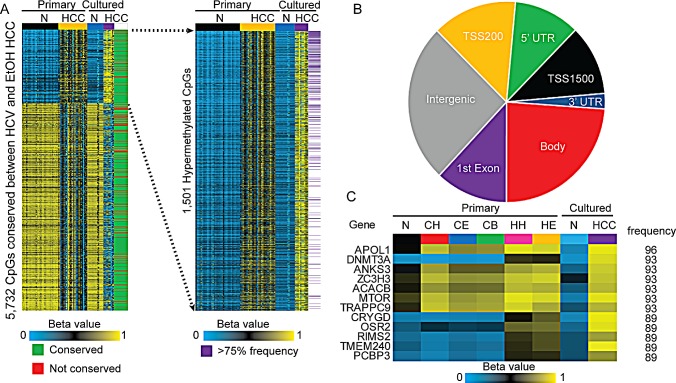
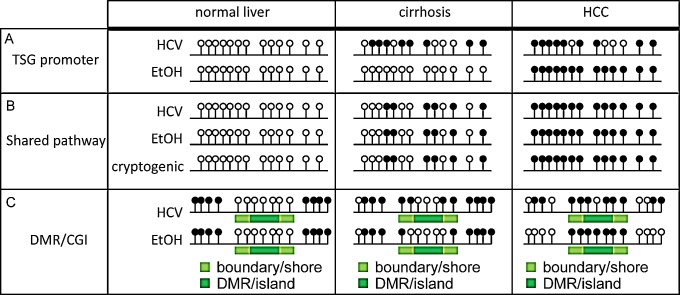
Hepatocellular carcinoma (HCC) is the second most common cause of cancer deaths worldwide. Deregulated DNA methylation landscapes are ubiquitous in human cancers. Interpretation of epigenetic aberrations in HCC is confounded by multiple etiologic drivers and underlying cirrhosis. We globally profiled the DNA methylome of 34 normal and 122 liver disease tissues arising in settings of hepatitis B (HBV) or C (HCV) viral infection, alcoholism (EtOH), and other causes to examine how these environmental agents impact DNA methylation in a manner that contributes to liver disease. Our results demonstrate that each 'exposure' leaves unique and overlapping signatures on the methylome. CpGs aberrantly methylated in cirrhosis-HCV and conserved in HCC were enriched for cancer driver genes, suggesting a pathogenic role for HCV-induced methylation changes. Additionally, large genomic regions displaying stepwise hypermethylation or hypomethylation during disease progression were identified. HCC-HCV/EtOH methylomes overlap highly with cryptogenic HCC, suggesting shared epigenetically deregulated pathways for hepatocarcinogenesis. Finally, overlapping methylation abnormalities between primary and cultured tumors unveil conserved epigenetic signatures in HCC. Taken together, this study reveals profound epigenome deregulation in HCC beginning during cirrhosis and influenced by common environmental agents. These results lay the foundation for defining epigenetic drivers and clinically useful methylation markers for HCC.


Figures

Figure 1
Figure 1. Histology of cirrhotic and hepatocellular carcinoma tissues
Histological cross-sections of representative liver tissue stained with H&E from cirrhosis-HCV (A), cirrhosis-EtOH (B), HCC-HCV (C), and HCC-EtOH (D) at 100x magnification.
Figure 2
Figure 2. Early epimutations in cirrhosis are related to etiologic exposure
A. Heatmap depicting beta values (β) for normal liver (n=34) or cirrhotic livers from HCV-infected individuals (HCV, n=39), chronic alcoholics (EtOH, n=21) or HBV-infected individuals (HBV, n=6). A color bar is shown with low methylation in blue, intermediate in black, and high methylation in yellow (FDR<0.05, Δβ>|0.1|). Samples are clustered based upon the groups into which they fall. CpGs were considered common if they were statistically significantly changed in more than one group. B. Venn diagram depicting the unique and overlapping CpG site changes in cirrhotic relative to normal liver using a change in β of at least 0.1.
Figure 3
Figure 3. Ethanol exposure is the dominant epigenetic effector in late-stage liver disease
A. Heatmap depicting the 18,257 CpGs whose methylation levels (β>|0.25|) are significantly different in HCC patient samples with hepatitis C infection (HCV) or in chronic alcoholics (EtOH) relative to normal liver. A color bar is shown to depict hypomethylation (blue) and hypermethylation (yellow) with intermediate methylation in black. B. Manhattan plot displaying changes specific to HCV infection (red), EtOH abuse (orange), or common to both (purple). Chromosomes 1-22 are color coded to demonstrate the distribution of methylation changes. C. Venn diagram depicting the unique DNA methylation changes found in HCC-HCV and HCC-EtOH, as well as conserved events between the two groups (Common to both). D. Bar chart depicting the number of DNA methylation changes in cirrhosis, TNM stage T1 and T2 (T1+T2) and TNM stage T3 and T4 (T3+T4) with a (Δβ>0.25, FDR<0.05) relative to normal liver.
Figure 4
Figure 4. Distribution of DNA methylation changes across genomic features
Bar charts depicting the relative percentage of DNA methylation changes at CpG islands (A) and intragenic (B) features (Δβ>0.25, FDR<0.05). Graphs above the x-axis depict hypermethylation, with hypomethylation events below. C. Dot plot showing the association between changes in TSS200 methylation and 1st Exon regions in HCC-HCV (red) and HCC-EtOH (blue) relative to normal liver. Trend lines are shown for HCC-HCV (green dashed line) and HCC-EtOH (orange dashed line). Correlation coefficients are shown. DNA methylation β-values across genes including 5,000 base pairs flanking the transcription start site (TSS) and transcription termination site (TTS) of the gene for HCC-HCV (D) and HCC-EtOH (E) based upon highly expressed (red) and lowly expressed (green) genes defined from analysis of normal liver.
Figure 5
Figure 5. Ontology of differentially methylated genes in cirrhosis and HCC
DAVID ontology for genes differentially methylated in HCV, HBV, and EtOH cirrhosis (A, Δβ>|0.1|), hypomethylated in HCC-HCV (B, Δβ<-0.25) or hypomethylated in HCC-EtOH (C, Δβ<-0.25). An expanded list of hypomethylated genes in HCC is shown in Supplemental Figure 4.
Figure 6
Figure 6. Differentially methylated regions (DMRs) in hepatocellular carcinoma
Changes in DNA methylation in HCV infected and chronic alcohol abuse (EtOH) HCC samples relative to normal liver at the EYA4 (A) and MEGF6 (B) loci. The threshold for the DMR is shown by a dashed green line, and the DMR length is depicted by red (HCC-HCV) and blue (HCC-EtOH) lines. Schematic representations of the genes are shown below. The overall hypermethylated and hypomethyated DMR number (C), DMR size (D) and number of CpGs within DMRs (E) for HCV (red), EtOH (blue), and CpGs common to both groups of HCC samples (purple).
Figure 7
Figure 7. Conservation of cirrhosis-HCV DNA methylation changes in HCC
A. Bar graph depicting the overlap of CpGs between cirrhosis-HCV (red) and cirrhosis-EtOH (blue) with HCC (p<0.05, β>|0.1|). B. Bar chart of DAVID gene ontology results for aberrantly methylated genes that overlap between cirrhosis-HCV and HCC. The resultant gene list, Δβ-values, and a heatmap is shown with hypermethylation events in yellow and hypomethylation events in blue (relative to normal). The CpG site location either near the transcription start site (TSS) or within the gene body (body) is listed.
Figure 8
Figure 8. Diverse DNA methylation changes in liver-associated cancers
A. Heatmap of statistically significant changes in hepatitis C infection (HCV), chronic alcoholic (EtOH), and cryptogenic HCC as well as metastases to the liver (Metastatic), and biliary tumors (Biliary) relative to normal liver. Hypermethylation is shown in yellow, hypomethylation in blue, and no change in black (p<0.05, Δβ>|0.25|). B. Venn diagrams of overlapping and non-overlapping DNA methylation changes with color-coded circles in HCC-HCV (red), HCC-EtOH (blue) and cryptogenic (top, purple), metastatic (middle, purple), and biliary (bottom, purple) tumors. C. DAVID gene ontology analysis for aberrantly methylated genes unique to cryptogenic (top), metastatic (middle), and biliary (bottom) tumors.
Figure 9
Figure 9. Conservation of hypermethylation and hypomethylation events between primary and cultured cells
A. Heatmap depicting methylation levels of CpG sites conserved between primary HCC-HCV and HCC-EtOH, and whether they are conserved (green) or not conserved (red) in HCC cell lines. β-values for primary and cultured normal (N) and HCC are shown (FDR<0.05, Δβ>|0.25|). Blow-up of CpGs hypermethylated in HCC and the frequency with which they are hypermethylated in primary HCC samples (purple, >75% frequency). B. Classification of hypermethylation events conserved between primary and cultured HCC based on their location in the genome. C. Heatmap depicting the most frequently hypermethylated CpGs in primary HCC, the average β-values for primary normal liver (N), cirrhosis-HCV (CH), cirrhosis-EtOH (CE), cirrhosis-HBV (CB), HCC-HCV (HH), HCC-EtOH (HE) as well as cultured normal hepatocytes (N) and HCC cell lines. The frequency of hypermethylation in primary HCC is listed on the right.
Figure 10
Figure 10. Schematic representation of DNA methylation changes during liver carcinogenesis
A. Methylation of a tumor suppressor gene (TSG) in normal liver, cirrhosis, and HCC. Samples with HCV-infection display hypermethylation during cirrhosis, which is overtaken by changes induced by chronic alcoholism in HCC. B. Locus showing conserved methylation patterns between different etiologies, representing progressive biomarkers for hepatocarcinogenesis. C. Depiction of differentially methylated region (DMR) boundary erosion during liver disease and priming of CpG island (CGI) hypermethylation through CGI shore methylation during cirrhosis, especially under conditions of HCV-infection.

References

    1. Jemal A, Bray F, Center MM, Ferlay J, Ward E, Forman D. Global cancer statistics. CA Cancer J Clin. 2011;61(2):69–90. - PubMed
    1. Ferlay J SI, Ervik M, Dikshit R, Eser S, Mathers C, Rebelo M, Parkin DM, Forman D, Bray F. GLOBOCAN 2012 v1.0, Cancer Incidence and Mortality Worldwide: IARC CancerBase No. 11 [Internet] Lyon, France: International Agency for Research on Cancer; 2013.
    1. El-Serag HB. Epidemiology of hepatocellular carcinoma in USA. Hepatol Res. 2007;37(Suppl 2):S88–94. - PubMed
    1. Bruix J, Boix L, Sala M, Llovet JM. Focus on hepatocellular carcinoma. Cancer Cell. 2004;5(3):215–219. - PubMed
    1. Marrero JA, Fontana RJ, Barrat A, Askari F, Conjeevaram HS, Su GL, Lok AS. Prognosis of hepatocellular carcinoma: comparison of 7 staging systems in an American cohort. Hepatology. 2005;41(4):707–716. - PubMed

Publication types