. 2014 Dec 1;42(21):e161.
doi: 10.1093/nar/gku864. Epub 2014 Oct 7.

svaseq: removing batch effects and other unwanted noise from sequencing data

Affiliations

svaseq: removing batch effects and other unwanted noise from sequencing data

Jeffrey T Leek. Nucleic Acids Res. .

Abstract

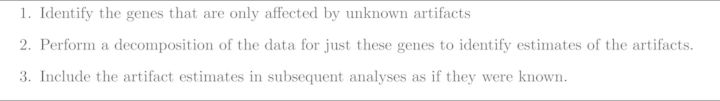
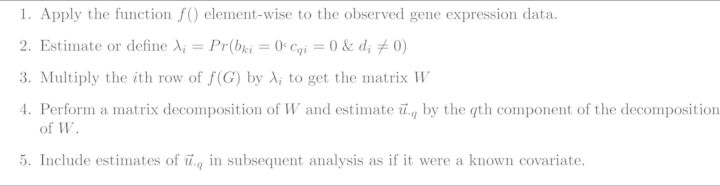
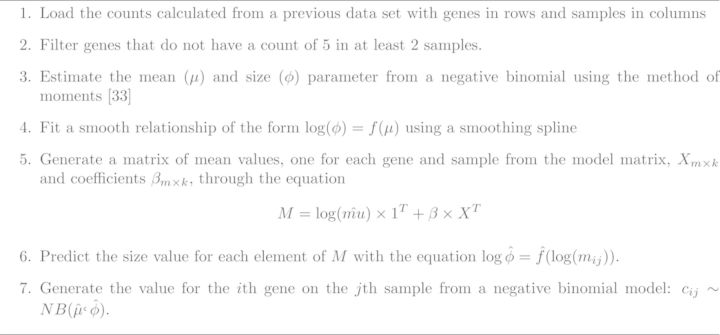
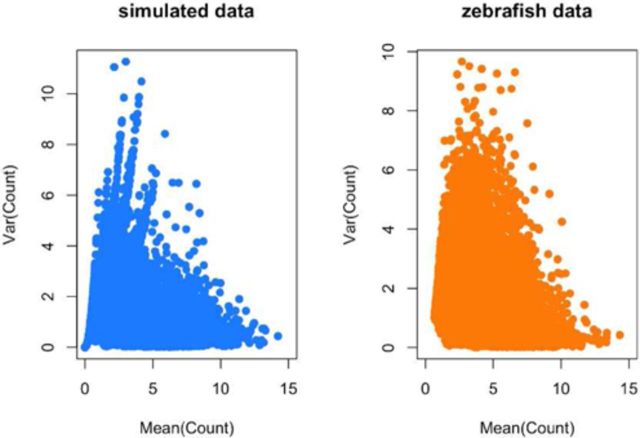
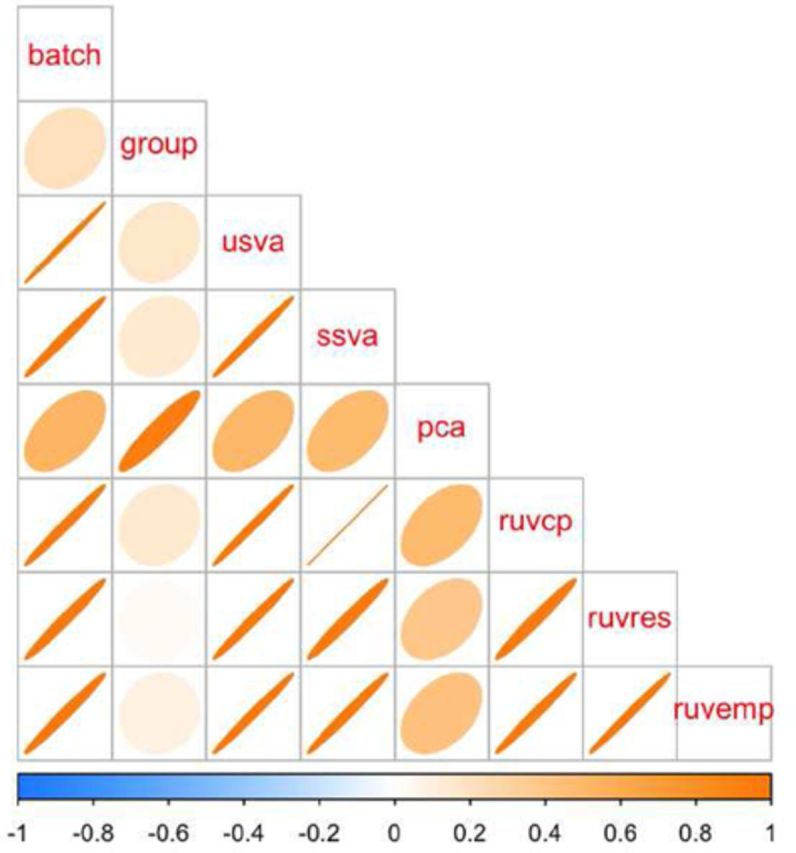
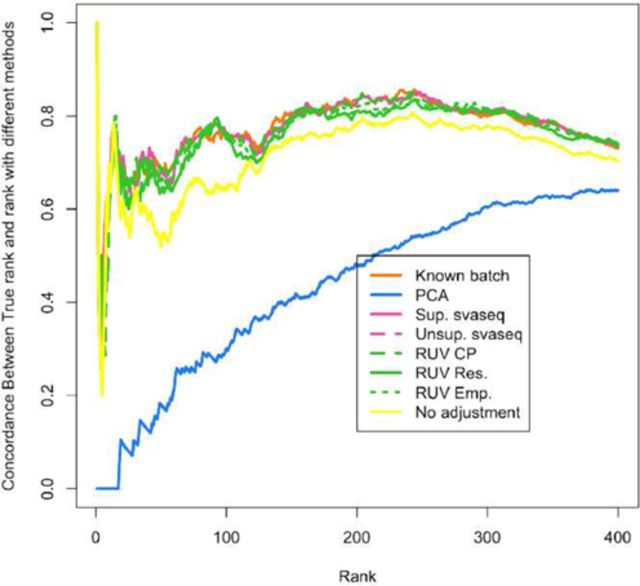
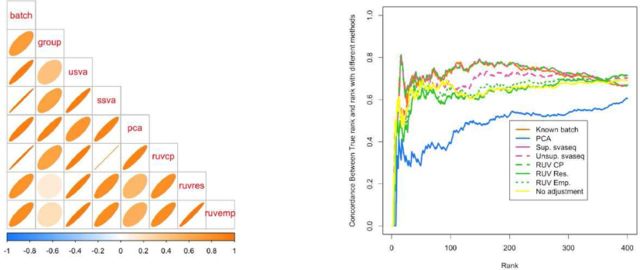
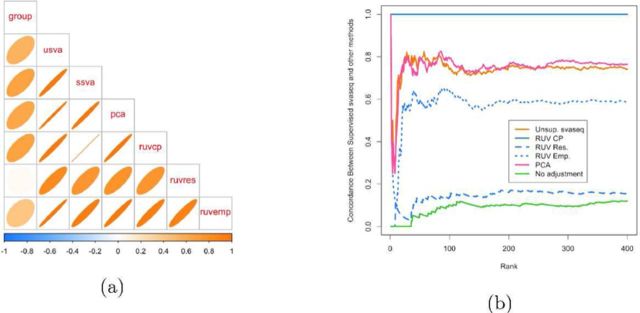
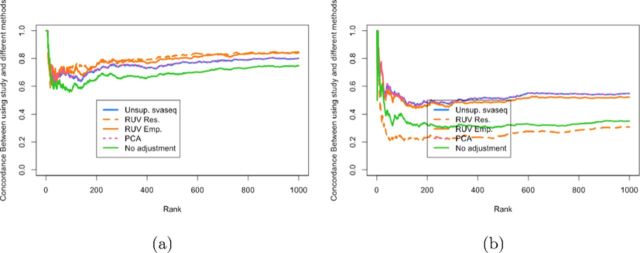
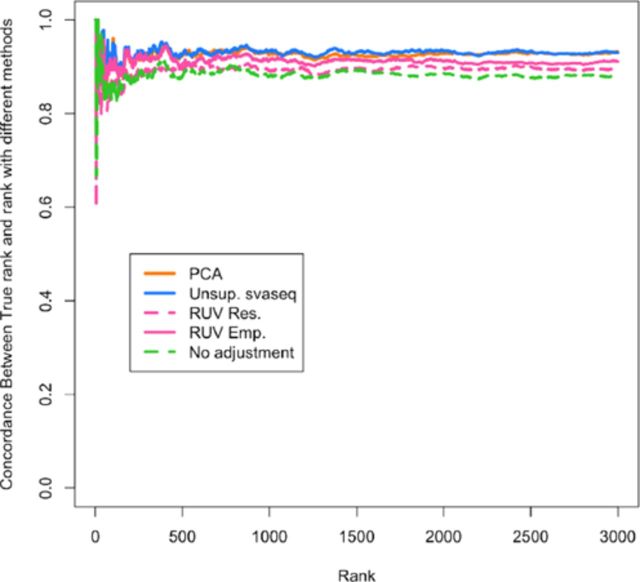
It is now known that unwanted noise and unmodeled artifacts such as batch effects can dramatically reduce the accuracy of statistical inference in genomic experiments. These sources of noise must be modeled and removed to accurately measure biological variability and to obtain correct statistical inference when performing high-throughput genomic analysis. We introduced surrogate variable analysis (sva) for estimating these artifacts by (i) identifying the part of the genomic data only affected by artifacts and (ii) estimating the artifacts with principal components or singular vectors of the subset of the data matrix. The resulting estimates of artifacts can be used in subsequent analyses as adjustment factors to correct analyses. Here I describe a version of the sva approach specifically created for count data or FPKMs from sequencing experiments based on appropriate data transformation. I also describe the addition of supervised sva (ssva) for using control probes to identify the part of the genomic data only affected by artifacts. I present a comparison between these versions of sva and other methods for batch effect estimation on simulated data, real count-based data and FPKM-based data. These updates are available through the sva Bioconductor package and I have made fully reproducible analysis using these methods available from: https://github.com/jtleek/svaseq.


Figures

Figure 1.
Figure 1.
Surrogate variable analysis (sva). The general sva framework for identifying unknown artifacts in genomic data has three steps (4,5).
Figure 2.
Figure 2.
General sva estimation framework. In this general framework, Step 1 allows for transformations specific to different data types, Step 2 allows for either estimating or defining the probabilities of being affected by unknown artifacts but not known variables and Step 4 allows for a variety of matrix decompositions and factor analysis approaches.
Figure 3.
Figure 3.
Approach for simulating RNA-seq data with Polyester package (34).
Figure 4.
Figure 4.
Distribution of means and variances for simulated and real Zebrafish data. To confirm that my simulation procedure produced reasonable simulated counts, I plotted the gene-specific means and variances for (left panel) the simulated data set and (right panel) the observed Zebrafish data set. The two distributions are qualitatively similar. Additional checks on the simulation procedure are provided in the simulated data analysis at http://jtleek.com/svaseq/simulateData.html.
Figure 5.
Figure 5.
Correlation between simulated batch and group variables and various batch estimates. Light circles indicate low correlation and dark, tight ellipses indicate high correlation. In this case, all estimates that respect multiple sources of signal (sva and RUV based) methods are highly correlated with the simulated batch effect. Principal components estimates a linear combination of the group and batch variable and has lower concordance with the true simulated batch and the other estimates. Additional details at http://jtleek.com/svaseq/simulateData.html.
Figure 6.
Figure 6.
Differential expression results for simulated data. A concordance at the top plot (CAT plot) shows the fraction of DE results that are concordant between the analysis with the true batch and the analyses using different batch estimates. Supervised (pink solid) and unsupervised (pink dotted) sva for sequencing, RUV with control probes (green dashed), RUV with empirical controls (green dotted) and residual RUV (green solid) all outperform not adjusting for batch effects (yellow) while principal components analysis (blue) performs worse than no adjustment. Additional details at http://jtleek.com/svaseq/simulateData.html.
Figure 7.
Figure 7.
Comparison of batch effect results when group and batch are correlated. (a) A plot of the correlation between the different batch estimates and the batch variable analogous to Figure 5. (b) A concordance at the top plot measuring concordance between the analysis using the true batch variable and the various estimates analogous to Figure 6. Here the unsupervised RUV approaches using empirical control probes and residuals perform worse than no adjustment, because the methods can not distinguish signal from the known group variable and the unknown batch variable. Additional details at http://jtleek.com/svaseq/simulateData.html.
Figure 8.
Figure 8.
Comparison of batch effect results on Zebrafish data. (a) A plot of the correlation between the different batch estimates analogous to Figure 5, but with no gold standard. (b) A concordance at the top plot measuring concordance between the analysis using the supervised SVA estimates and the various other batch estimates analogous to Figure 6. The control probes RUV approach (blue solid in (b)) and supervised sva approach produce identical results. The unsupervised sva (orange solid) and principal components (pink solid) approaches are most similar to the supervised estimates in this scenario. Additional details at http://jtleek.com/svaseq/zebrafish.html.
Figure 9.
Figure 9.
Comparison of differential expression results for ReCount experiment. (a) A concordance at the top plot measuring concordance between the analysis using the true study and the various other batch estimates analogous to Figure 6. (b) A concordance at the top plot measuring concordance between the analysis using the true study and the various other batch estimates analogous to Figure 6 when data were resampled to make the sex and study variables moderately correlated (r2 = 0.33.) When sex and study are uncorrelated, RUV performs slightly better and when sex and study are correlated, svaseq performs slightly better. Additional details at http://jtleek.com/svaseq/recount.html.
Figure 10.
Figure 10.
Differential expression results for GEUVADIS data. A concordance at the top plot (CAT plot) shows the fraction of DE results that are concordant between the analysis with the true laboratory and the analyses using different batch estimates. Unsupervised sva for sequencing (blue) and principal components analysis (orange) outperform the RUV based methods (pink) and no batch adjustment (green). Additional details at http://jtleek.com/svaseq/geuvadis.html.

References

    1. Akey J.M., Biswas S., Leek J.T., Storey J.D. On the design and analysis of gene expression studies in human populations. Nat. Genet. 2007;39:807–808. - PubMed
    1. Sebastiani P., Solovieff N., Puca A., Hartley S.W., Melista E., Andersen S., Dworkis D.A., Wilk J.B., Myers R.H., Steinberg M.H., et al. Genetic signatures of exceptional longevity in humans. Science. 2010;2010 doi:10.1126/science.1190532. - PubMed
    1. Lambert C.G., Black L.J. Learning from our GWAS mistakes: from experimental design to scientific method. Biostatistics. 2012;13:195–203. - PMC - PubMed
    1. Leek J., Storey J. Capturing heterogeneity in gene expression studies by ‘Surrogate Variable Analysis’. PLoS Genet. 2007;3:e161. - PMC - PubMed
    1. Leek J., Storey J. A general framework for multiple testing dependence. PNAS. 2008;105:18718–18723. - PMC - PubMed

Publication types