. 2014 Oct 29;42(19):11865-78.
doi: 10.1093/nar/gku810. Epub 2014 Oct 7.

Explicit DNase sequence bias modeling enables high-resolution transcription factor footprint detection

Affiliations

Explicit DNase sequence bias modeling enables high-resolution transcription factor footprint detection

Galip Gürkan Yardımcı et al. Nucleic Acids Res. .

Abstract

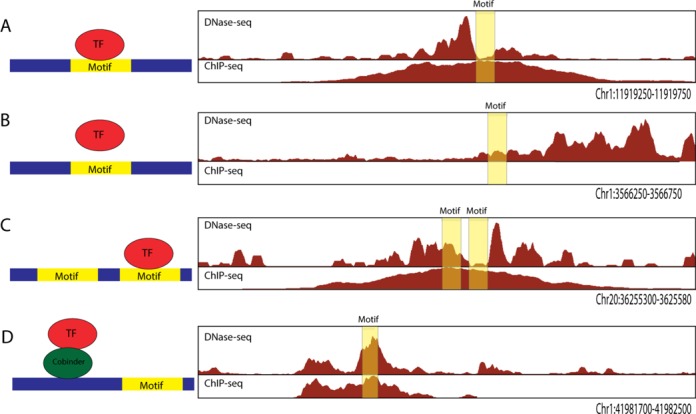
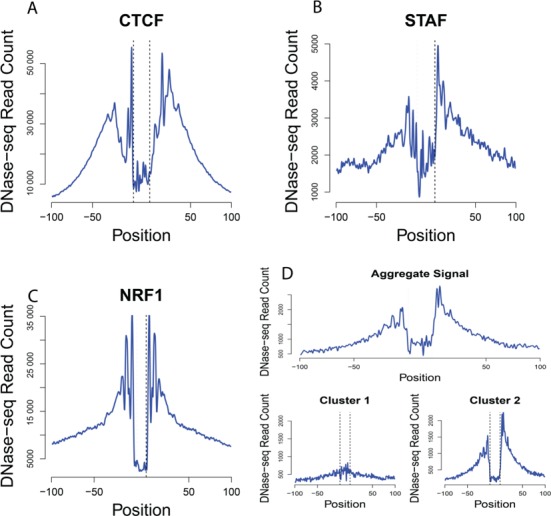
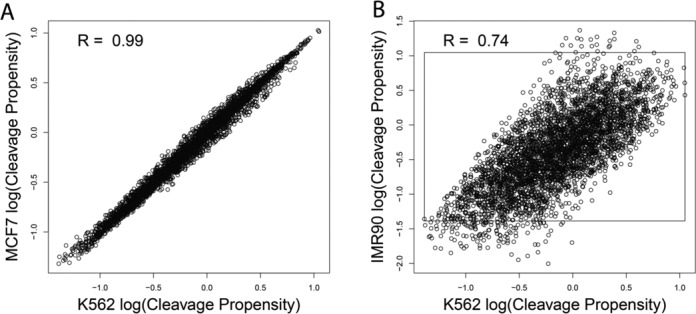
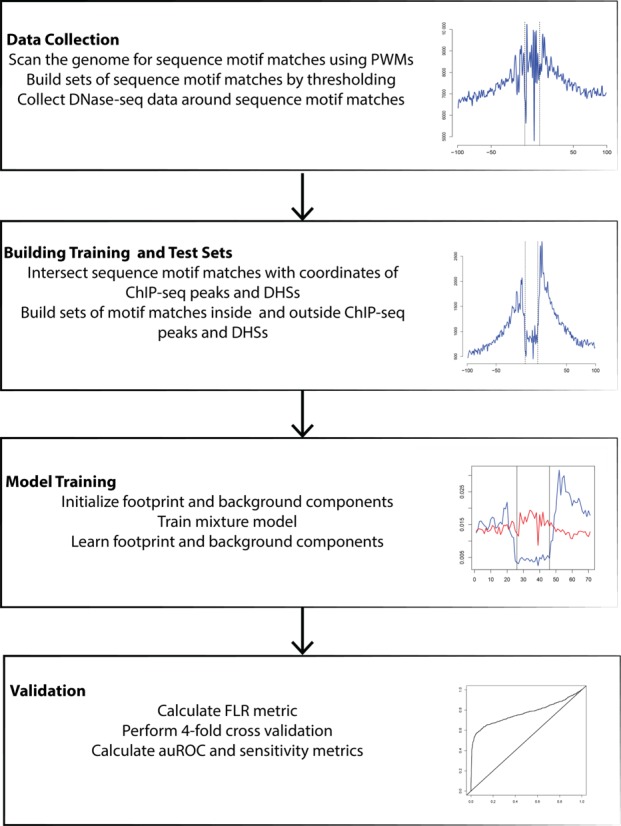
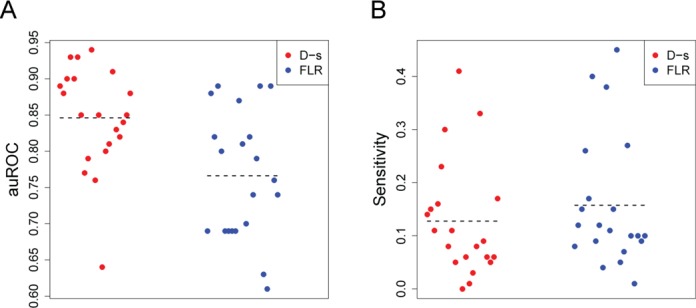
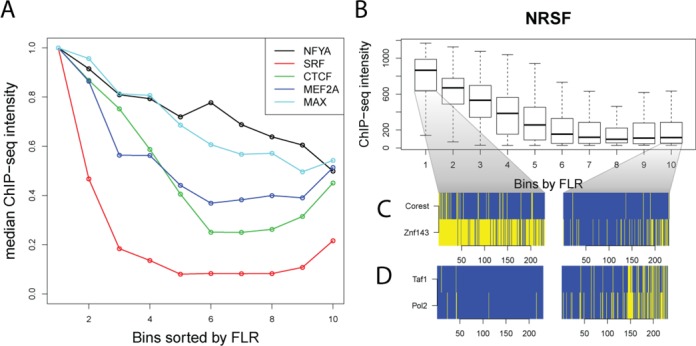
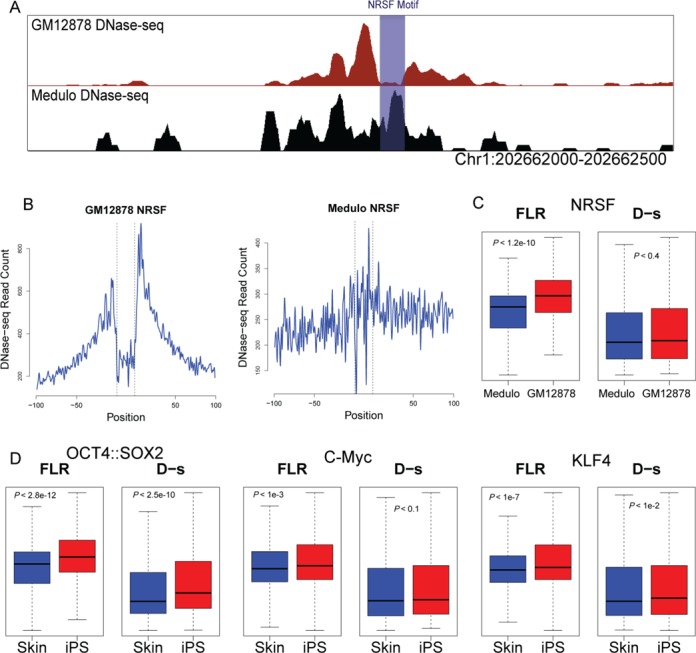
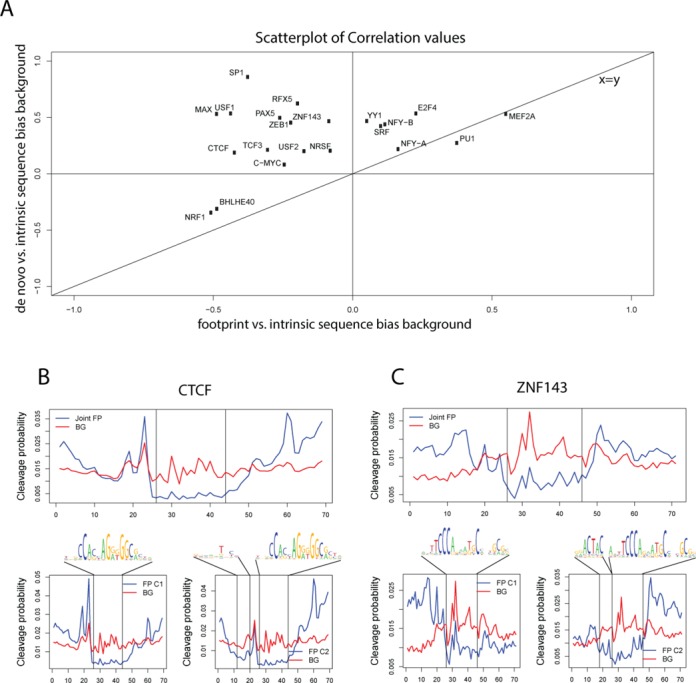
DNaseI footprinting is an established assay for identifying transcription factor (TF)-DNA interactions with single base pair resolution. High-throughput DNase-seq assays have recently been used to detect in vivo DNase footprints across the genome. Multiple computational approaches have been developed to identify DNase-seq footprints as predictors of TF binding. However, recent studies have pointed to a substantial cleavage bias of DNase and its negative impact on predictive performance of footprinting. To assess the potential for using DNase-seq to identify individual binding sites, we performed DNase-seq on deproteinized genomic DNA and determined sequence cleavage bias. This allowed us to build bias corrected and TF-specific footprint models. The predictive performance of these models demonstrated that predicted footprints corresponded to high-confidence TF-DNA interactions. DNase-seq footprints were absent under a fraction of ChIP-seq peaks, which we show to be indicative of weaker binding, indirect TF-DNA interactions or possible ChIP artifacts. The modeling approach was also able to detect variation in the consensus motifs that TFs bind to. Finally, cell type specific footprints were detected within DNase hypersensitive sites that are present in multiple cell types, further supporting that footprints can identify changes in TF binding that are not detectable using other strategies.


Figures

Figure 1.
Figure 1.
Scenarios relevant to identifying DNase footprints. On the right, representative examples of DNase-seq data from GM12878 cell type and ChIP-seq data for NRSF from ENCODE (34). The location of sequence motif match for the TF NRSF is indicated with a yellow box. On the left, a schematic representation of TF–DNA interaction is shown and whether a footprint is detected or not detected at the motif match. (A) A DNase footprint centered at the motif maps within a ChIP-seq peak indicating a direct binding event. (B) A motif that maps within a DHS site, but has no appreciable ChIP-seq signal, nor footprint, indicating no interaction between TF and sequence motif match. (C) Multiple sequence motif matches within a DHS site may only have a single footprint, showing that TF may be more likely to interact with one of the motif matches. (D) ChIP-seq peak with a sequence motif match that does not have a footprint suggests a possible indirect binding event.
Figure 2.
Figure 2.
Aggregate DNase plots identify distinct TF-binding profiles. Aggregate DNase-seq signal was calculated for motifs that map within ChIP-seq peaks for (A) CTCF, (B) STAF (ZNF143) and (C) NRF1. Note that each TF displays variation of general footprint shapes, indicating that footprint detection requires a TF-specific approach. (D) Top panel shows aggregate DNase-seq signal centered on REST motif matches that map within REST ChIP-seq peaks. K-means clustering of the REST aggregate plot (top) identifies two types of DNase aggregate profiles (bottom). Cluster 1 identifies subset of REST-binding sites that does not display depletion of DNase signal, while Cluster 2 represents REST-binding sites with depletion of DNase-seq signal.
Figure 3.
Figure 3.
DNase-seq displays cleavage bias that is protocol specific. (A) Scatter plot of cleavage propensities of all possible DNA 6-mers (log10 scale) for deproteinized genomic DNA from MCF7 and K562 cell lines using the single hit high molecular weight DNase-seq protocol (31). (B) Scatter plot comparing cleavage propensities of 6mers from deproteinized genomic DNA from K562 using the single hit DNase-seq protocol versus deproteinized genomic DNA from IMR90 cell line using an independent two hit small molecular weight DNase-seq protocol (42). The inset box represents maximum and minimum cleavage propensity values for single hit DNase-seq protocol performed on K562 cell line. Spearman correlation is indicated in each plot.
Figure 4.
Figure 4.
Workflow of binary classification scheme.
Figure 5.
Figure 5.
Comparison of FLR to general D-s score. Motif matches for 21 TFs that map within DHS sites were compared to ChIP-seq data to calculate (A) auROC and (B) sensitivity at 1% false-positive rate for FLR and D-s scores. Each TF is indicated as a circle, dashed lines represent the means.
Figure 6.
Figure 6.
Footprint scores indicate mode of TF interaction. (A) Median ChIP-seq intensity scores of ChIP-seq peaks of five factors, sorted by FLR footprint scores in descending order and divided into 10 bins. The highest FLR scores are in the first bin. Note footprint score correlates with ChIP-seq signal, with the exception of the weakest footprinting scores where they are inversely correlated. (B) Boxplots of NRSF ChIP-seq intensity scores across footprint scores. (C) A heat-map showing overlapping ChIP-seq peaks for the top and bottom 10% highest and lowest footprint scores. CoRest and Znf143 binding is enriched for the strongest NRSF footprints (left) and are depleted in the weakest NRSF footprints (right). (D) Conversely, Taf1 and Pol2 binding is depleted for the strongest NRSF footprints (left), and enriched for the weakest NRSF footprints (right).
Figure 7.
Figure 7.
Cell type specific footprints in shared DHS sites. (A) Representative example of DNase-seq data from GM12878 and Medulloblastoma (D721) cell lines. This DHS site is present in both cell types, but a clear footprint for NRSF is only detected in GM12878 at the sequence motif match (B) Aggregate DNase-seq signal around NRSF motifs in GM12878 (left) and medulloblastoma (right) cell lines indicate that NRSF does not leave a footprint in the medulloblastoma cell line. (C) Boxplots showing distribution of FLR and D-s scores in GM12878 and Medulloblastoma cell lines for the NRSF motif in DHS sites that are present in both cell types. Distribution of FLR scores displays a difference between GM12878 and Medulloblastoma, whereas D-s scores displays no difference. (D) Similar boxplots showing distributions of FLR and D-s to identify differential footprint scores between skin fibroblasts and iPSc cells for OCT4, Sox2, C-Myc and KLF4 Yamanaka factors. FLR scores were more sensitive to changes in TF binding between two cell types, reflected by smaller P values indicated in each box and Supplementary Table S4.
Figure 8.
Figure 8.
EM footprint components distinguish background bias and footprints, as well as alternate motif usage. (A) Correlation of intrinsic DNase-seq sequence bias profile (generated from deproteinized naked DNA DNase-seq) compared to the de novo foreground footprint component (X axis) and de novo background component (Y axis) of multinomial mixture model. For 19 TFs the de novo background component learned by mixture model correlates more with intrinsic sequence bias model. The majority of de novo foreground footprint models correlate negatively with intrinsic sequence bias model. (B) Combined footprint model for CTCF against the de novo background component in the upper panel and the two footprint components (C1 and C2) that make up the footprint in the lower two panels, with the sequence logo associated with each component for CTCF. Vertical lines delimit the PWM we used for this factor. An additional motif associated with the depletion in second footprint component can be seen upstream of the main motif. (C) Similarly for ZNF143, extended motif corresponds to a bigger footprint for the second component.

References

    1. Ernst J., Kheradpour P., Mikkelsen T.S., Shoresh N., Ward L.D., Epstein C.B., Zhang X., Wang L., Issner R., Coyne M., et al. Mapping and analysis of chromatin state dynamics in nine human cell types. Nature. 2011;473:43–49. - PMC - PubMed
    1. Hoffman M.M., Buske O.J., Wang J., Weng Z., Bilmes J.A., Noble W.S. Unsupervised pattern discovery in human chromatin structure through genomic segmentation. Nat. Methods. 2012;9:473–476. - PMC - PubMed
    1. Crawford G.E., Holt I.E., Mullikin J.C., Tai D., Blakesley R., Bouffard G., Young A., Masiello C., Green E.D., Wolfsberg T.G., et al. Identifying gene regulatory elements by genome-wide recovery of DNase hypersensitive sites. Proc. Natl. Acad. Sci. U.S.A. 2004;101:992–997. - PMC - PubMed
    1. Boyle A.P., Davis S., Shulha H.P., Meltzer P., Margulies E.H., Weng Z., Furey T.S., Crawford G.E. High-resolution mapping and characterization of open chromatin across the genome. Cell. 2008;132:311–322. - PMC - PubMed
    1. Thurman R.E., Rynes E., Humbert R., Vierstra J., Maurano M.T., Haugen E., Sheffield N.C., Stergachis A.B., Wang H., Vernot B., et al. The accessible chromatin landscape of the human genome. Nature. 2012;489:75–82. - PMC - PubMed

Publication types

Associated data