. 2014 Oct 8:5:5005.
doi: 10.1038/ncomms6005.

Concomitant Notch activation and p53 deletion trigger epithelial-to-mesenchymal transition and metastasis in mouse gut

Affiliations

Concomitant Notch activation and p53 deletion trigger epithelial-to-mesenchymal transition and metastasis in mouse gut

Maia Chanrion et al. Nat Commun. .

Abstract

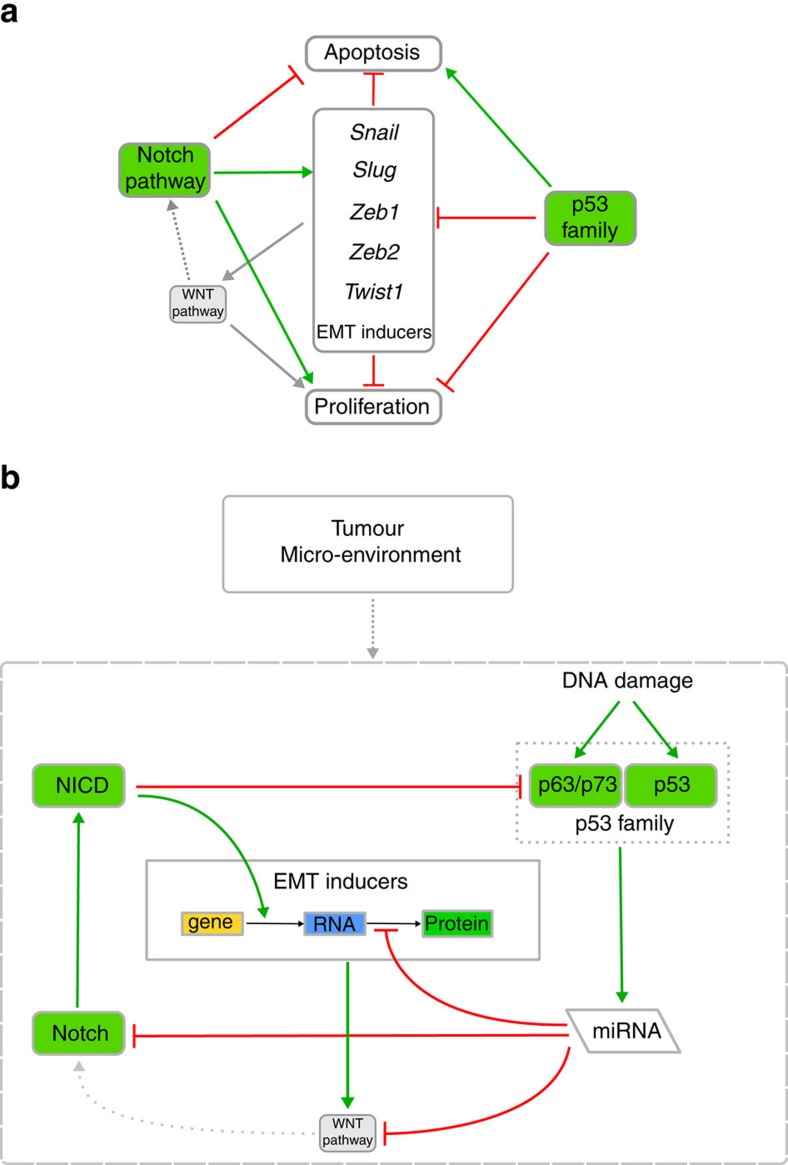
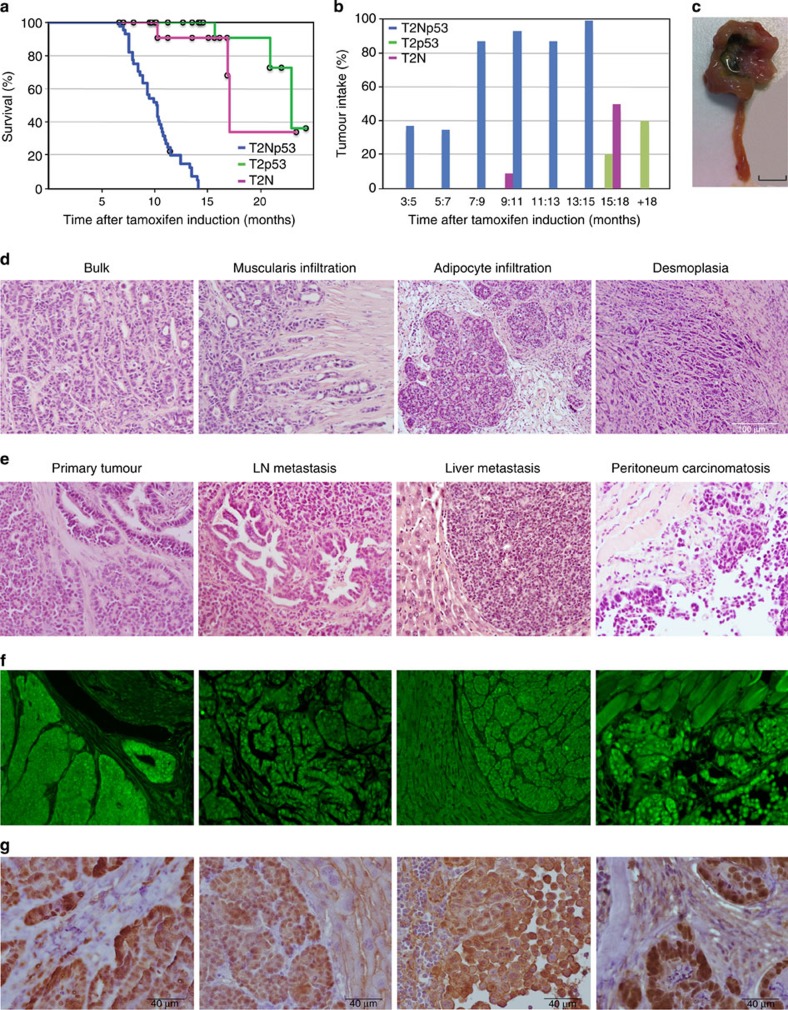
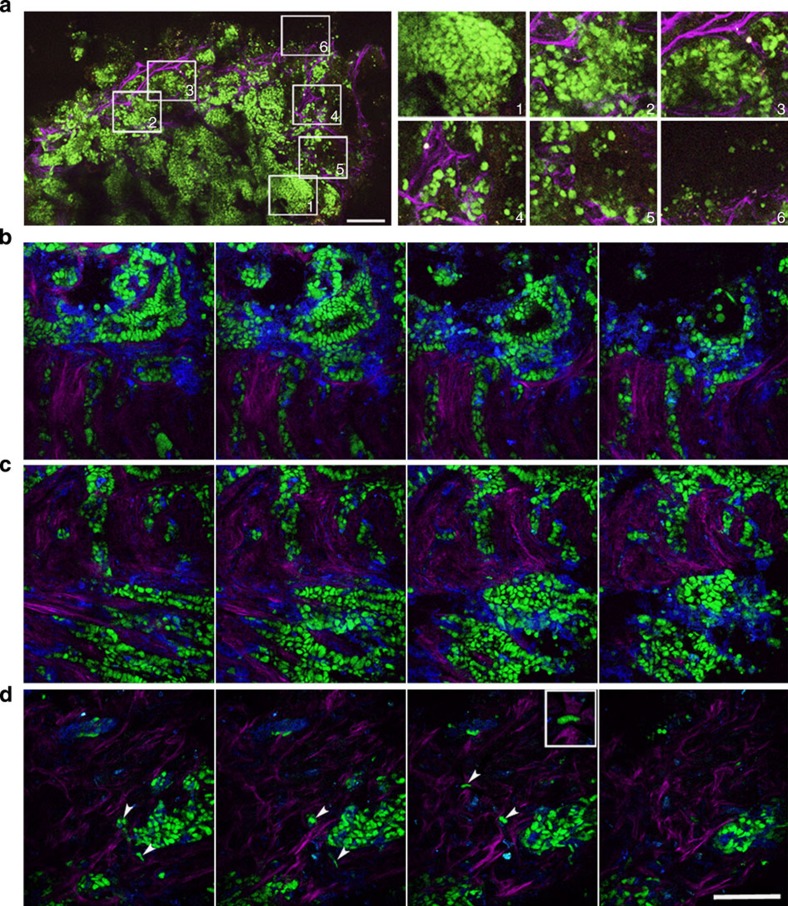
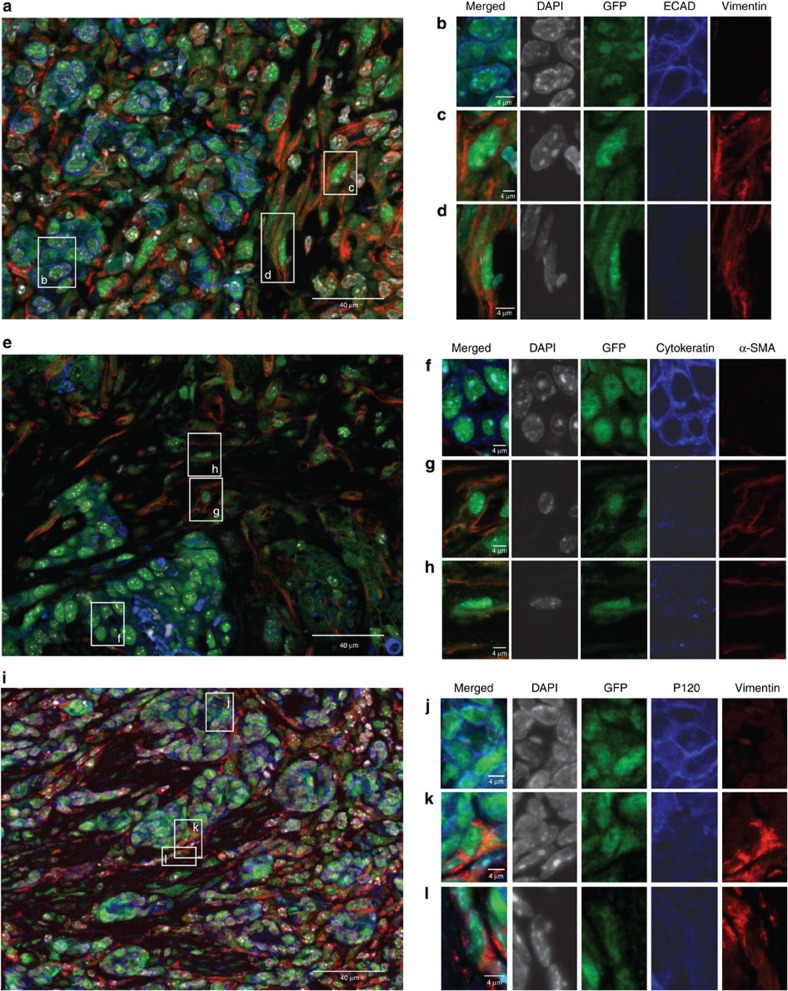
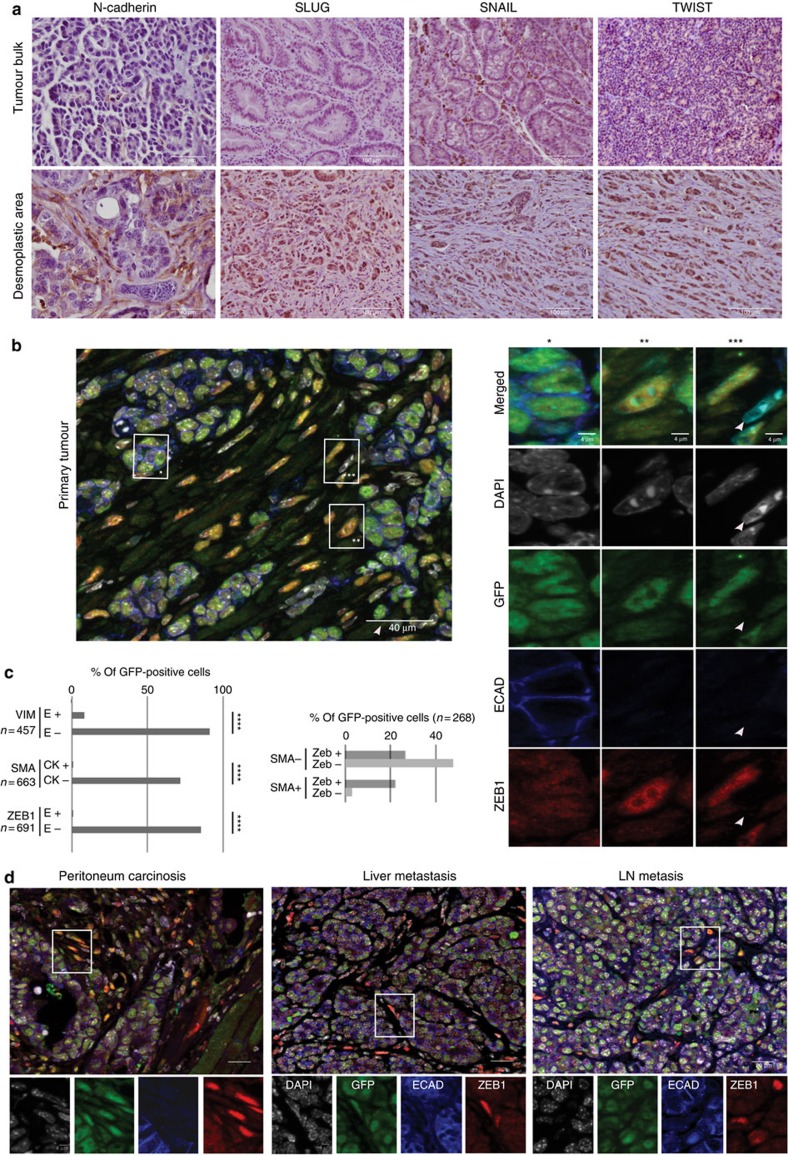
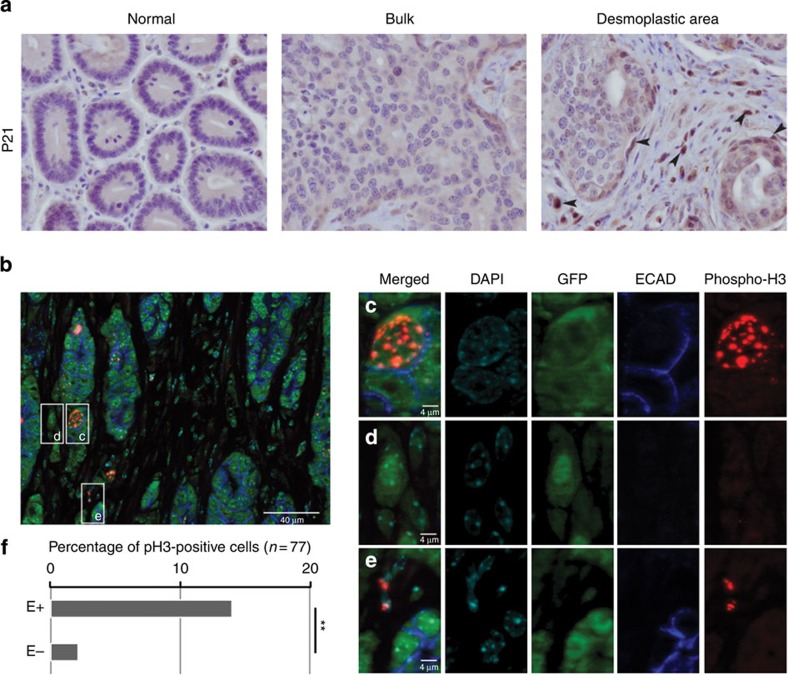
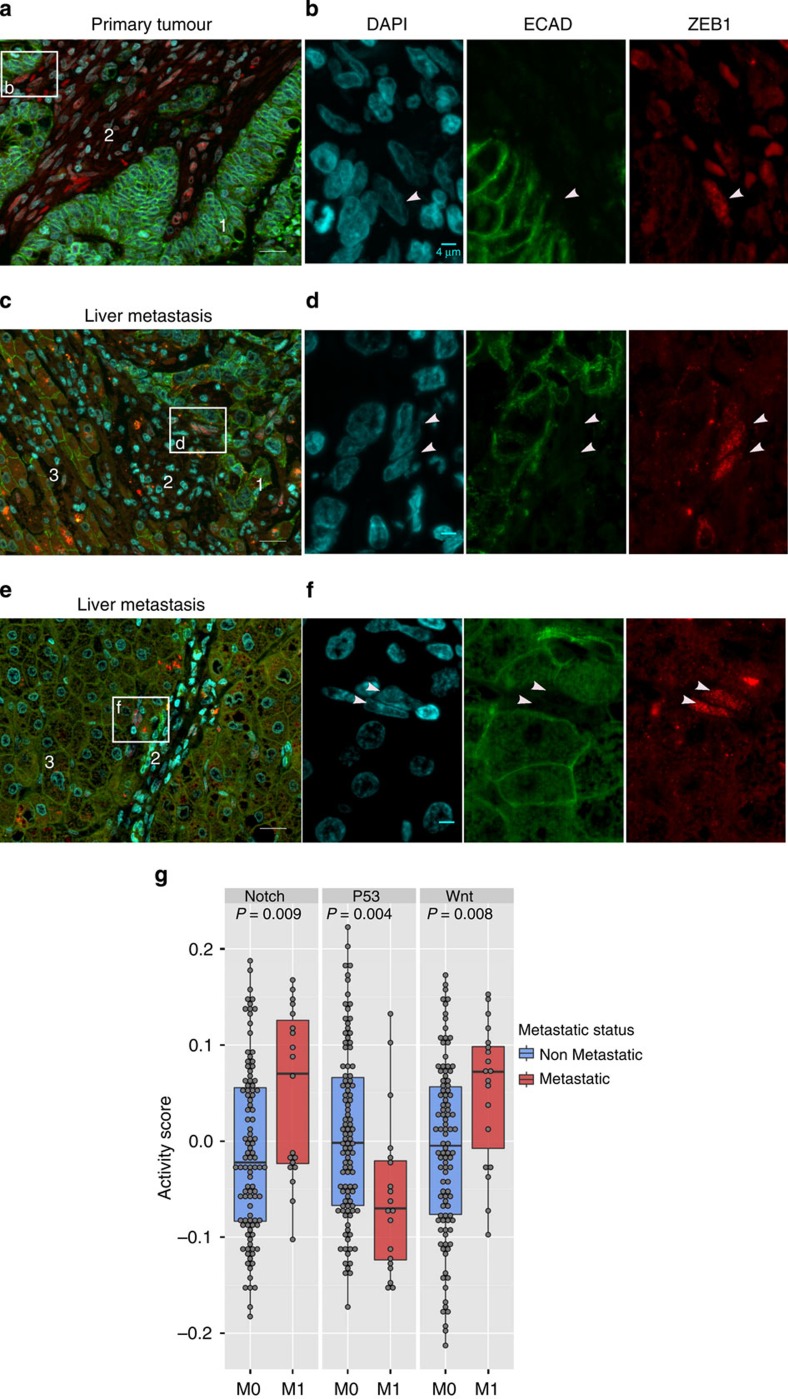
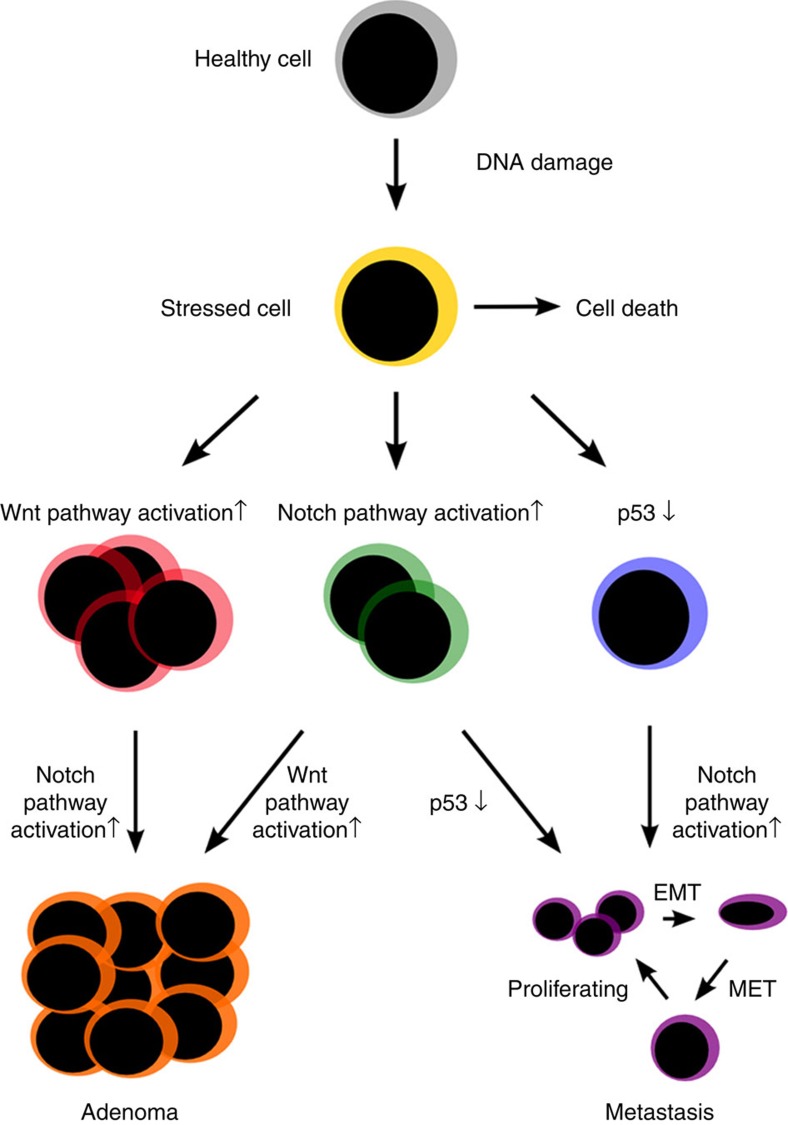
Epithelial-to-mesenchymal transition-like (EMT-like) is a critical process allowing initiation of metastases during tumour progression. Here, to investigate its role in intestinal cancer, we combine computational network-based and experimental approaches to create a mouse model with high metastatic potential. Construction and analysis of this network map depicting molecular mechanisms of EMT regulation based on the literature suggests that Notch activation and p53 deletion have a synergistic effect in activating EMT-like processes. To confirm this prediction, we generate transgenic mice by conditionally activating the Notch1 receptor and deleting p53 in the digestive epithelium (NICD/p53(-/-)). These mice develop metastatic tumours with high penetrance. Using GFP lineage tracing, we identify single malignant cells with mesenchymal features in primary and metastatic tumours in vivo. The development of such a model that recapitulates the cellular features observed in invasive human colorectal tumours is appealing for innovative drug discovery.


Figures

Figure 1
Figure 1. A hypothesis on Notch–p53 and Wnt interplay derived from signalling network analysis.
Green and grey arrows indicate an activating effect, red arrows depict an inhibiting effect and dotted line indicates an indirect effect. (a) Schematic view of three signalling pathways (Wnt, Notch and p53) and the phenotypes of apoptosis, proliferation and EMT induction, showing crosstalk between each other. (b) Schematic view at a molecular level showing the involvement of Notch and Wnt pathways, p53 family and microRNAs in activating EMT inducers. The p53 family members (p53, p63 and p73) can be activated by DNA damage and can induce transcription of miRNAs (for example, miR34, miR200 and miR203). These miRNAs target mRNAs coding for β-catenin (Wnt pathway), Notch and the EMT inducers (Snail, Twist, Slug, Zeb1 and Zeb2). Those EMT inducers activate the Wnt pathway that, in turn, activates the Notch pathway, resulting in the activation of Notch (NICD). NICD activates the gene expression of EMT inducers, but can also inhibit transcription of p63 and p73, but not p53. Various signals from tumour microenvironment as extracellular matrix (ECM) components, hormones, growth factors, inflammatory factors and so on (collectively denoted as ‘Tumour microenvironment’ node) can sensitize the activation of EMT programme only in those cells that are in contact with microenvironmental signals.
Figure 2
Figure 2. Characterization of NICD/p53−/− primary tumours and metastases.
(a) Kaplan–Meier analysis of NICD/p53−/− mice and their single transgenic littermates NICD (pink) and p53−/− (green) over a period of 2 years. The triple transgenic mice (blue) are all dead by 15 months with gut adenocarcinoma, whereas control littermates (pink and green) are dying after 15 months. (b) Tumour intake in the intestinal tract of NICD/p53−/− cohort mice and their relative control littermates at different time points after tamoxifen induction. NICD/p53−/− mice (blue) develop intestinal adenocarcinoma faster and with a higher penetrance than control littermates (pink and green). (c) Macroscopic view of a primary invasive adenocarcinoma located in the jejunum of a NICD/p53−/− mouse. Scale bar, 1 cm. (d) haematoxylin and eosin staining (H&E) staining on paraffin-embedded primary tumour from NICD/p53−/− mice, representing main features of the tumour. Cancer cells are invading all layers of normal tissue to reach the serosa. We suspect that elongated, single cancer cells are present in desmoplastic areas. Scale bar, 40 μm. (e) H&E and (f) nuclear GFP stainings showing primary tumour, lymph node and liver metastases, and peritoneal carcinomatosis in NICD/p53−/− compound mice. Notice the nonspecific staining due to autofluorescence in the surrounding tumour tissue of lymph node (LN) or liver metastasis and peritoneum carcinomatosis. Scale bars, 40 μm. (g) Immunohistochemical staining of β-catenin showing its nuclear delocalization in cancer cells and its overexpression at the tumour front. Scale bars, 40 μm.
Figure 3
Figure 3. Ex vivo analysis of tumour slices by two-photon microscopy.
(a) Ex vivo tumour slice from NICD/p53−/− mice observed by two-photon microscopy and represented as mosaic of 9 × 9 connected tiles. Epithelial cells have GFP-positive nuclei (green), second harmonic generation (SHG, pink) reveals the presence of collagen I. Insets represent higher magnification of several tumour areas (1–3 tumour bulk; 4–6 invasive areas). Scale bar, 100 μm. (bd) Several examples of ex vivo tumour slices from NICD/p53−/− mice. Epithelial cells (GFP-positive nuclei, green), collagen I (SHG, pink), all cells (membrane dye, FM 4-64, blue). Images are taken from a Z-stack with 6 μm between planes. (b) Invasive front of the tumour. Note that stromal cells surround cancer cells. (c) Cancer cells invading stroma as clusters and strings parallel to the collagen fibres. (d) Cluster and single cancer cells invading collagen-rich stroma. Single cancer cells are labelled with white arrowheads. Inset, higher magnification of individual cancer cell with elongated nucleus. Scale bar, 100 μm.
Figure 4
Figure 4. An EMT-like phenotype is induced in NICD/p53−/− primary tumours.
(a,e,i) Triple immunofluorescence of primary tumours using 4′,6-diamidino-2-phenylindole (grey) and GFP staining (green), an epithelial marker (blue) and a mesenchymal marker (red). Scale bars, 40 μm. bd,fh,jl represent magnifications of the boxes lettered in a,e,i, respectively. (b,f,j) Clusters of epithelial cells express GFP and epithelial markers (ECAD, Pan cytokeratin and P120) but do not express mesenchymal markers (vimentin and α-SMA). (c,d,g,h,k,l) Single GFP-positive cells, with an epithelial origin, lose epithelial markers and acquire mesenchymal ones irrespective of whether they have epithelial (c,g,k) or fibroblast (d,h,l) nuclear morphology. Scale bars, 4 μm.
Figure 5
Figure 5. Characterization of an EMT-like phenotype in NICD/p53−/− primary tumours.
(a) Staining of the mesenchymal marker N-cadherin and the EMT transcription factors, SNAIL, SLUG and TWIST in NICD/p53−/− primary tumours. Left panel: N-cadherin is overexpressed in tumour cells invading the desmoplastic area compared with those from the tumour bulk. Scale bars, 40 μm. Middle and right panels: a nuclear overexpression of EMT transcription factors is observed in cancer cells from the desmoplastic area compared with differentiated tubular structures. Scale bars, 100 μm. (b,c) Expression of the EMT-inducer ZEB1 in primary tumours of NICD/p53−/−. (b) Left panel: triple immunofluorescence on NICD/p53−/− primary tumours using 4,6-diamidino-2-phenylindole (DAPI; grey) and GFP staining (green), ECAD (blue) and ZEB1 (red). Scale bars, 40 μm. Right panel: magnification of different tumour cell features coming from the same slide showing that cells undergoing EMT-like processes express the EMT-inducer ZEB1. *Zeb1 negative epithelial tumour cells; ** and *** Zeb1 and GFP-positive, ECAD-negative cells, independently of their morphology. Scale bars, 4 μm. The white arrow labels individual ZEB1-negative cells with a non-epithelial origin. (c) The left bar graph shows the frequency of vimentin, SMA or Zeb1-positive cells among GFP-positive cells. Cells were separated in two groups presenting either an epithelial phenotype described by ECAD-positive cells (E+) or cytokeratin-positive cells (CK+), or an EMT-like phenotype characterized by ECAD negative (E−) or CK negative (CK−). The associated tables of contingency (Supplementary Table 4) depict a strong negative correlation (***) between ZEB1 and ECAD expressions (P<0.001), vimentin and ECAD expressions (χ2 test, P<0.001) or SMA and CK expressions (χ2 test, P<0.001). The right bar graph shows the distribution of Zeb1 and SMA among GFP positive cells. ZEB1 is expressed in SMA-negative cells in 27% of GFP-positive cells and in SMA-positive cells for 22.4% GFP-positive cells. Only 3% of GFP-positive are ZEB1-negative cells and SMA positive, suggesting that a small fraction of cells have fully completed the EMT process. (d) Triple immunofluorescence on NICD/p53−/− metastatic tissues using DAPI (grey), GFP staining (green), ECAD (blue) and ZEB1 (red; scale bars, 20 μm) with magnifications of one area showing the presence of GFP-intestinal cancer cells with mesenchymal features in the secondary organs (scale bars, 4 μm).
Figure 6
Figure 6. EMT-like cells are not proliferative.
(a) Immunohistochemical staining of P21 in NICD/p53−/− primary tumours, showing nuclear P21 expression in cancer cells at the tumour front. This feature is emphasized in cancer cells invading the desmoplastic area. Scale bars, 100 μm. (b) Triple immunofluorescence on NICD/p53−/− primary tumours using 4′,6-diamidino-2-phenylindole (grey), GFP staining (green), ECAD (blue) and phospho-H3 (red). Scale bars, 40 μm. (ce) Magnification of different tumour cell features coming from the same slide showing some epithelial cells in clusters (c) or fibroblasts (e) in division whether EMT-like cells are quiescent (d). Scale bars, 4 μm. (f) Proportion of pH3-positive cells among GFP-positive cells. Among GFP-positive cells, 12% of cells with an epithelial morphology as defined by ECAD positivity (E+; n=585) are proliferative, while only 2% of ECAD-negative cells (E−; n=274) express pH3 (full contingency table indicates dependency χ2 test, P<0.0001, **). This indicates that cells undergoing EMT-like are less proliferative.
Figure 7
Figure 7. EMT signalling activation in human samples with CRC.
(af) Double immunofluorescence on human samples with CRC using ZEB1 (red) and ECAD (green). (a) CRC primary tumour and (c,e) liver metastasis, showing ZEB1-positive/ECAD-negative cells invading the desmoplastic area in primary tumour and in liver metastasis. Numbers on a,c,e indicate different cell types observed on the slide as follows: 1 for colorectal primary (in a) or metastatic cells (in c), 2 for stroma cells and 3 for hepatocytes. Scale bars, 20 μm. Magnifications from the boxes b,d,f are also represented in b,d,f single 4′,6-diamidino-2-phenylindole, ECAD and ZEB1 staining. ZEB1-positive cells (labelled with an arrowhead) in the liver metastasis are either observed next to colorectal tumour cells (d) or surrounded by hepatic tissue (f). Scale bars, 4 μm. (g) The activity scores computed for the Notch, p53 and Wnt pathways in human colon cancer samples from Tumour Cancer Genome Atlas data set. The data points represent primary tumour samples grouped as non-metastatic (blue) and metastatic (red) according to the observation of distant metastases. The bottom and top of the box correspond to the first and third quartiles of the activity score values, and the band inside the box represents the median. P values are calculated using the two-sample t-test between the two groups.
Figure 8
Figure 8. Schematic representation of phenotypes observed in single and double mutants.
When DNA damage occurs in a healthy cell, the cell can undergo apoptosis if the damage is severe enough. If another mutation then occurs, this can lead to different cell phenotypes depending on the kind of mutation: Apc loss-of-function mutation, as well as Notch activation will give rise to increased proliferation. A p53 loss-of-function mutation will give rise to a cell phenotype that is able to survive, as apoptosis can no longer be induced by p53. A sequential mutation will lead to either adenoma or metastases depending on the preceding mutation. MET: mesenchymal epithelial transition. The predicted phenotypes have been confirmed by experiments.

References

    1. Steeg P. S. Tumor metastasis: mechanistic insights and clinical challenges. Nat. Med. 12, 895–904 (2006). - PubMed
    1. Valastyan S. & Weinberg R. A. Tumor metastasis: molecular insights and evolving paradigms. Cell 147, 275–292 (2011). - PMC - PubMed
    1. Kalluri R. & Weinberg R. A. The basics of epithelial-mesenchymal transition. J. Clin. Invest. 119, 1420–1428 (2009). - PMC - PubMed
    1. Peinado H., Olmeda D. & Cano A. Snail, Zeb and bHLH factors in tumour progression: an alliance against the epithelial phenotype? Nat. Rev. Cancer 7, 415–428 (2007). - PubMed
    1. Casas E. et al. Snail2 is an essential mediator of Twist1-induced epithelial mesenchymal transition and metastasis. Cancer Res. 71, 245–254 (2011). - PMC - PubMed

Publication types

MeSH terms