. 2014 Oct 7;107(7):1647-53.
doi: 10.1016/j.bpj.2014.08.007.

Determining intrachain diffusion coefficients for biopolymer dynamics from single-molecule force spectroscopy measurements

Affiliations

Determining intrachain diffusion coefficients for biopolymer dynamics from single-molecule force spectroscopy measurements

Michael T Woodside et al. Biophys J. .

Abstract

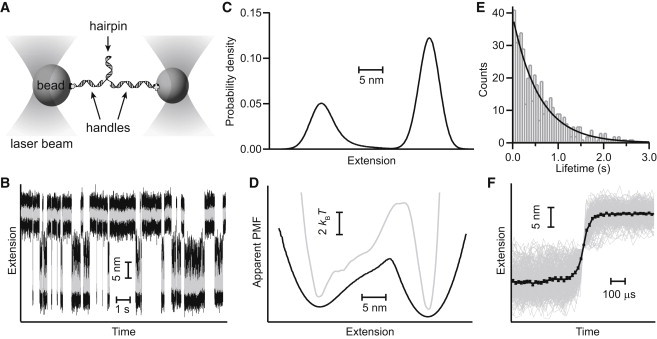
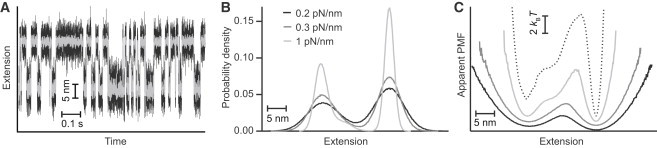
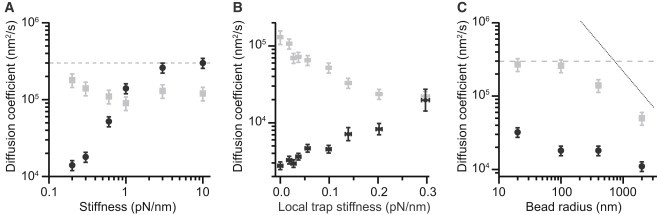
The conformational diffusion coefficient for intrachain motions in biopolymers, D, sets the timescale for structural dynamics. Recently, force spectroscopy has been applied to determine D both for unfolded proteins and for the folding transitions in proteins and nucleic acids. However, interpretation of the results remains unsettled. We investigated how instrumental effects arising from the force probes used in the measurement can affect the value of D recovered via force spectroscopy. We compared estimates of D for the folding of DNA hairpins found from measurements of rates and energy landscapes made using optical tweezers with estimates obtained from the same single-molecule trajectories via the transition path time. The apparent D obtained from the rates was much lower than the result found from the same data using transition time analysis, reflecting the effects of the mechanical properties of the force probe. Deconvolution of the finite compliance effects on the measurement allowed the intrinsic value to be recovered. These results were supported by Brownian dynamics simulations of the effects of force-probe compliance and bead size.


Figures

Figure 1
Figure 1
Landscape and kinetic analysis of DNA hairpin folding. (A) Schematic of measurement: a single hairpin connected to DNA handles is attached to beads held in optical traps, which apply tension to the hairpin. (B) Representative trajectory of the extension of a hairpin molecule (hairpin 30R50/T4) held at a constant force with a passive force clamp such that it fluctuates between folded (low extension) and unfolded (high extension) states. Gray data have been filtered to illustrate the two states more clearly. (C) Distribution of the extensions in the hairpin trajectory. (D) Apparent PMF found from an inverse Boltzmann transform of the extension distribution (black), and the landscape after deconvolution to remove the effects of the compliant handles and probes (gray). Curves offset for clarity. (E) Lifetimes of each state (here, the unfolded state) are distributed exponentially, yielding the folding rate. (F). Unfolding transitions aligned on the transition midpoint (gray) and averaged (black) yield an upper-bound estimate for the average transition time of 64 μs.
Figure 2
Figure 2
Simulations of folding trajectories. (A) Simulated trajectory for a bead radius of 400 nm and stiffness of 0.3 pN/nm. Gray data have been filtered to illustrate the two states more clearly. (B) Distributions of the bead position for different stiffness values, illustrating the broadening because of increased compliance. (C) Apparent PMFs recovered by inverse Boltzmann transform from the position distributions, for different stiffness values (black: 0.2 pN/nm; dark gray: 0.3 pN/nm; light gray: 1 pN/nm), illustrating convergence toward the actual landscape (dotted line) at high stiffness. Curves offset for clarity.
Figure 3
Figure 3
Effects of stiffness and bead radius on apparent diffusion coefficient. (A) The diffusion coefficient recovered from simulations using Eq. 1 (black) approaches at high stiffness the actual value used in the simulations (dashed line). Using Eq. 2 (gray) yields values that provide a better estimate at low stiffness. (B) Experiments on hairpin 20R50/T4 varying the local stiffness of one of the traps reveal similar trends in the diffusion coefficient as a function of stiffness, with estimates from Eq. 1 (black) improving as the stiffness increases, whereas estimates from Eq. 2 (gray) are best at low stiffness. (C) The diffusion coefficient as a function of bead size recovered from simulations using Eq. 2 (gray) approaches the actual value in the simulation (dashed line) for small bead sizes, but is reduced as the bead size increases, being bounded above by the coefficient for diffusion of a free bead (dotted line). The estimate from Eq. 1 (black) is much lower than that from Eq. 2, owing to the low stiffness used in the simulation.

References

    1. Bryngelson J.D., Wolynes P.G. Spin glasses and the statistical mechanics of protein folding. Proc. Natl. Acad. Sci. USA. 1987;84:7524–7528. - PMC - PubMed
    1. Dill K.A., MacCallum J.L. The protein-folding problem, 50 years on. Science. 2012;338:1042–1046. - PubMed
    1. Gopich I.V., Nettels D., Szabo A. Protein dynamics from single-molecule fluorescence intensity correlation functions. J. Chem. Phys. 2009;131:095102. - PMC - PubMed
    1. Kramers H.A. Brownian motion in a field of force and the diffusion model of chemical reactions. Physica. 1940;7:284–304.
    1. Chung H.S., Louis J.M., Eaton W.A. Experimental determination of upper bound for transition path times in protein folding from single-molecule photon-by-photon trajectories. Proc. Natl. Acad. Sci. USA. 2009;106:11837–11844. - PMC - PubMed

Publication types

LinkOut - more resources