. 2014 Oct 7;107(7):1675-85.
doi: 10.1016/j.bpj.2014.08.008.

Computational studies of the effect of the S23D/S24D troponin I mutation on cardiac troponin structural dynamics

Affiliations

Computational studies of the effect of the S23D/S24D troponin I mutation on cardiac troponin structural dynamics

Yuanhua Cheng et al. Biophys J. .

Abstract

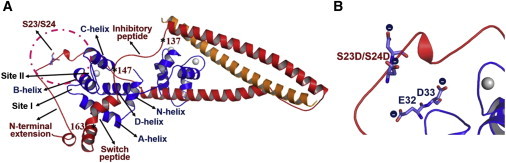
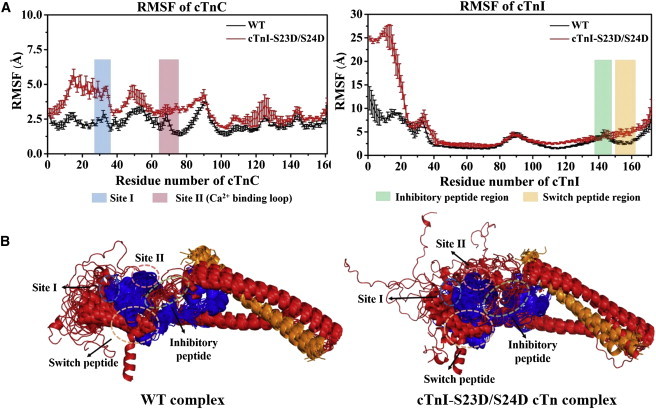
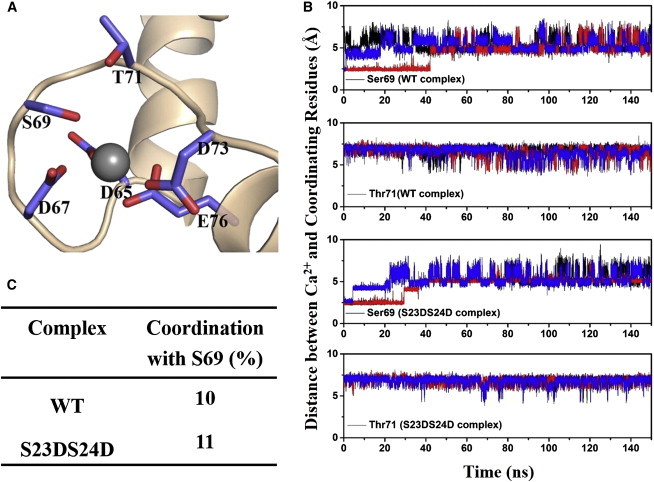
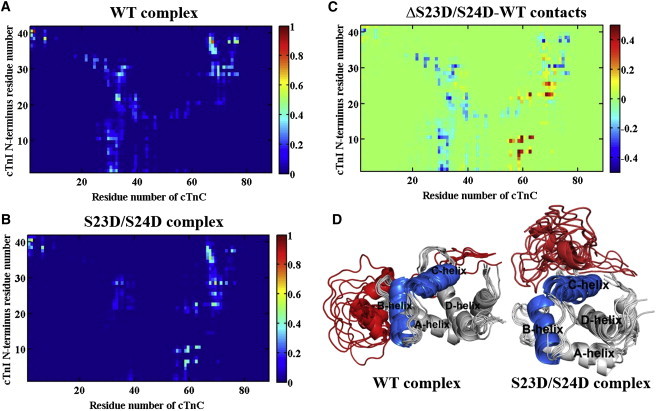
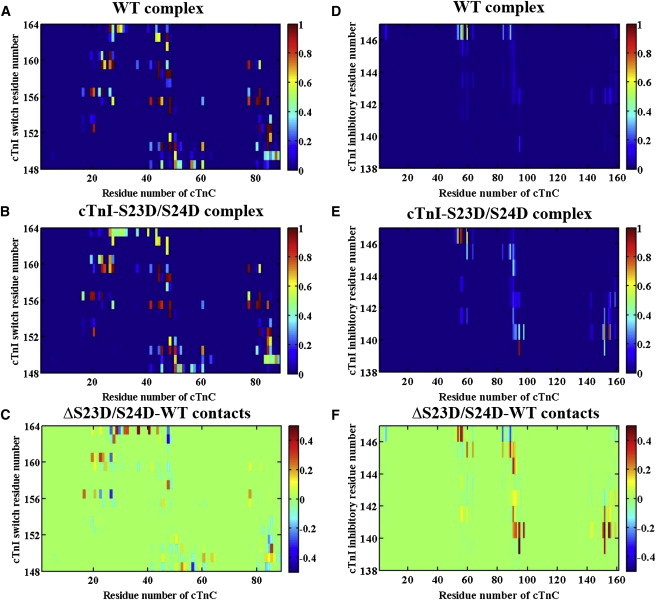
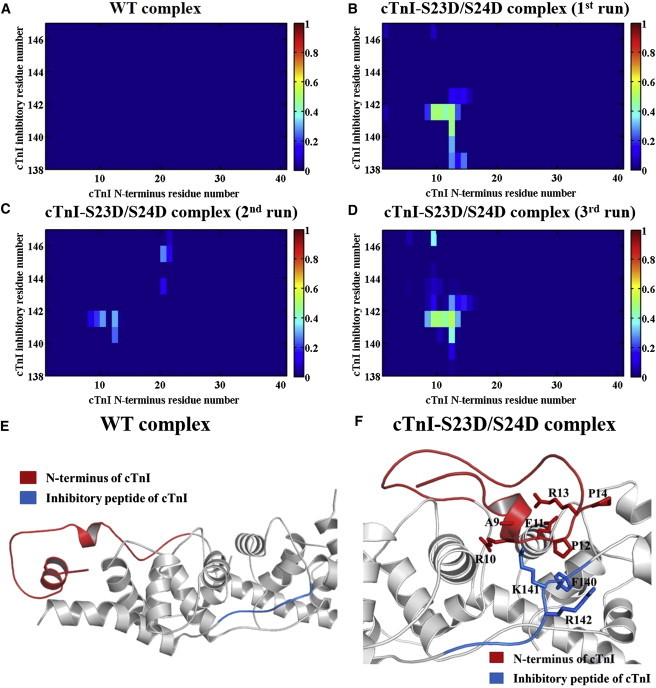
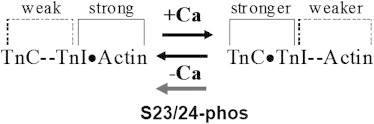
During β-adrenergic stimulation, cardiac troponin I (cTnI) is phosphorylated by protein kinase A (PKA) at sites S23/S24, located at the N-terminus of cTnI. This phosphorylation has been shown to decrease KCa and pCa50, and weaken the cTnC-cTnI (C-I) interaction. We recently reported that phosphorylation results in an increase in the rate of early, slow phase of relaxation (kREL,slow) and a decrease in its duration (tREL,slow), which speeds up the overall relaxation. However, as the N-terminus of cTnI (residues 1-40) has not been resolved in the whole cardiac troponin (cTn) structure, little is known about the molecular-level behavior within the whole cTn complex upon phosphorylation of the S23/S24 residues of cTnI that results in these changes in function. In this study, we built up the cTn complex structure (including residues cTnC 1-161, cTnI 1-172, and cTnT 236-285) with the N-terminus of cTnI. We performed molecular-dynamics (MD) simulations to elucidate the structural basis of PKA phosphorylation-induced changes in cTn structure and Ca(2+) binding. We found that introducing two phosphomimic mutations into sites S23/S24 had no significant effect on the coordinating residues of Ca(2+) binding site II. However, the overall fluctuation of cTn was increased and the C-I interaction was altered relative to the wild-type model. The most significant changes involved interactions with the N-terminus of cTnI. Interestingly, the phosphomimic mutations led to the formation of intrasubunit interactions between the N-terminus and the inhibitory peptide of cTnI. This may result in altered interactions with cTnC and could explain the increased rate and decreased duration of slow-phase relaxation seen in myofibrils.


Figures

Figure 1
Figure 1
(A) The initial structures of the WT cTn complex were built up based on Takeda et al.’s (11) crystal structure and Howarth et al.’s (21) NMR structure. The inhibitory-peptide region (residues 138–147) of cTnI and the C-terminus (residues 280–285) of cTnT were modeled using Rosetta. cTnC (1–161) is shown in blue, cTnI (residues 1–172) is in red, and cTnT (residues 236–285) is in gold. Asterisks indicate the key positions in cTnI. (B) Close-up of the region around sites 23/24 of cTnI in the cTnI-S23D/S24D cTn model. The substitutions result in close apposition of negative charges on D23/D24 of cTnI with E32 and D33 between the A- and B-helices of cTnC. To see this figure in color, go online.
Figure 2
Figure 2
(A) Comparison of average (± SD) RMSF values of cTnC and cTnI for both the WT and cTnI-S23D/S24D cTn systems in triplicate rounds of MD simulations. Site I and site II (the Ca2+-binding loop) of cTnC are highlighted in blue and pink, respectively, and the inhibitory-peptide and switch-peptide regions of cTnI are highlighted in green and orange, respectively. (B) Superposition of snapshots (in cartoon representation) extracted every 10 ns during 150 ns MD simulations for both complexes. cTnC is shown in blue, cTnI is in red, cTnT is in gold, and all key regions are highlighted with dashed circles. To see this figure in color, go online.
Figure 3
Figure 3
(A) Structure of the site II Ca2+-binding loop at the beginning of the simulation. Six coordinating residues are in stick representation. (B) Distances between Ca2+ and its coordinating cTnC site II residues (Ser-69 and Thr-71) over the course of each MD simulation for both complexes. The first run result is shown in black, the second run result is in red, and the third run result is in blue. (C) Coordinating time (percentage) of Ser-69 with Ca2+ during totally 450 ns MD simulations for the WT and cTnI-S23D/S24D cTn complexes. To see this figure in color, go online.
Figure 4
Figure 4
(A and B) Average contact maps of residue-residue pairs between NcTnC and NcTnI during 450 ns MD simulations for the (A) WT and (B) cTnI-S23D/S24D complexes. The blue end of the spectrum (value = 0) reflects no contact between the residue-residue pair, and the red end of the spectrum (value = 1) represents 100% contact between the residue-residue pair. (C) Difference contact map of residue-residue pairs between NcTnC and NcTnI that were most affected upon introduction of the phosphomimic mutations. The color green (value = 0) reflects no difference between the two systems, the red end of the spectrum (values > 0) reflects more contacts in the cTnI-S23D/S24D cTn system, and the blue end of the spectrum (values < 0) indicates more contacts in the WT model. (D) Comparison of interactions between NcTnC and NcTnI during the last 70 ns (from 80 ns to 150 ns) of MD simulations for WT and cTnI-S23D/S24D complexes. The B-helix (residues 38–48) and C-helix (residues 54–64) of NcTnC (residues 1–89) are highlighted in blue, the other region of NcTnC is shown in gray, and NcTnI (residues 1–41) is in red. To see this figure in color, go online.
Figure 5
Figure 5
(A and B) Average contact maps of residue-residue pairs between NcTnC and cTnI switch peptides for (A) WT and (B) cTnI-S23D/S24D complexes. (C) Difference contact map of residue-residue pairs between NcTnC and cTnI switch peptides that were most affected upon introduction of the phosphomimic mutations. (D and E) Average contact maps of residue-residue pairs between cTnC and cTnI inhibitory peptides for the (D) WT and (E) cTnI-S23D/S24D complexes. (F) Difference contact map of residue-residue pairs between cTnC and cTnI inhibitory peptides that were most affected upon introduction of the phosphomimic mutations. To see this figure in color, go online.
Figure 6
Figure 6
(A) Average contact map of residue-residue pairs between the N-terminus and the inhibitory-peptide region of cTnI for the WT model. (B–D) Contact maps of residue-residue pairs between the N-terminus and inhibitory-peptide region of cTnI in cTnI-S23D/S24D complexes for three runs of simulations. (E and F) Representative binding pattern between the N-terminus (red) and the inhibitory-peptide region (blue) of cTnI in the (E) WT and (F) cTnI-S23D/S24D cTn models. To see this figure in color, go online.
Scheme 1
Scheme 1
Flow chart of interactions among cTnC, cTnI, and actin in the presence and absence of Ca2+, as well as phosphorylation of the S23/S24 residues of cTnI.

References

    1. Gordon A.M., Homsher E., Regnier M. Regulation of contraction in striated muscle. Physiol. Rev. 2000;80:853–924. - PubMed
    1. Davis J.P., Norman C., Tikunova S.B. Effects of thin and thick filament proteins on calcium binding and exchange with cardiac troponin C. Biophys. J. 2007;92:3195–3206. - PMC - PubMed
    1. Farah C.S., Reinach F.C. The troponin complex and regulation of muscle contraction. FASEB J. 1995;9:755–767. - PubMed
    1. Zhang R., Zhao J., Potter J.D. Cardiac troponin I phosphorylation increases the rate of cardiac muscle relaxation. Circ. Res. 1995;76:1028–1035. - PubMed
    1. Kentish J.C., McCloskey D.T., Solaro R.J. Phosphorylation of troponin I by protein kinase A accelerates relaxation and crossbridge cycle kinetics in mouse ventricular muscle. Circ. Res. 2001;88:1059–1065. - PubMed

Publication types

LinkOut - more resources