

The growing price gap between more and less healthy foods: analysis of a novel longitudinal UK dataset
- PMID: 25296332
- PMCID: PMC4190277
- DOI: 10.1371/journal.pone.0109343
The growing price gap between more and less healthy foods: analysis of a novel longitudinal UK dataset
Abstract
Objectives: The UK government has noted the public health importance of food prices and the affordability of a healthy diet. Yet, methods for tracking change over time have not been established. We aimed to investigate the prices of more and less healthy foods over time using existing government data on national food prices and nutrition content.
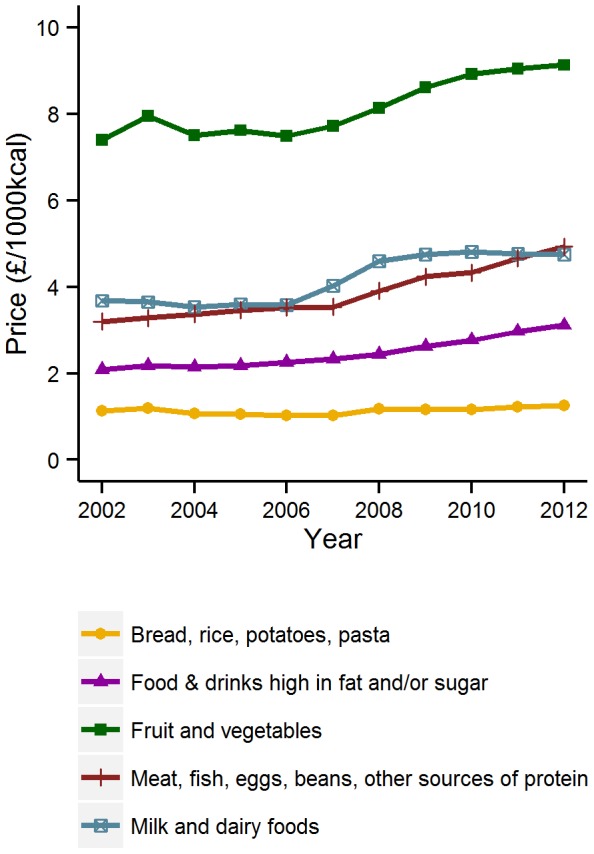
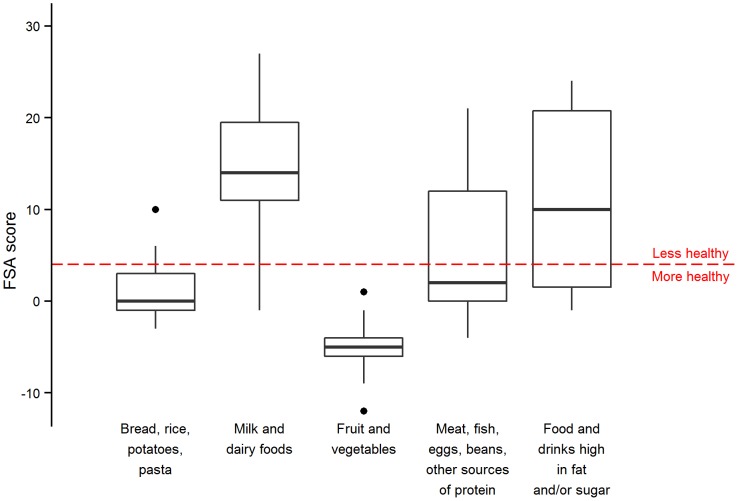
Methods: We linked economic data for 94 foods and beverages in the UK Consumer Price Index to food and nutrient data from the UK Department of Health's National Diet and Nutrition Survey, producing a novel dataset across the period 2002-2012. Each item was assigned to a food group and also categorised as either "more healthy" or "less healthy" using a nutrient profiling model developed by the Food Standards Agency. We tested statistical significance using a t-test and repeated measures ANOVA.
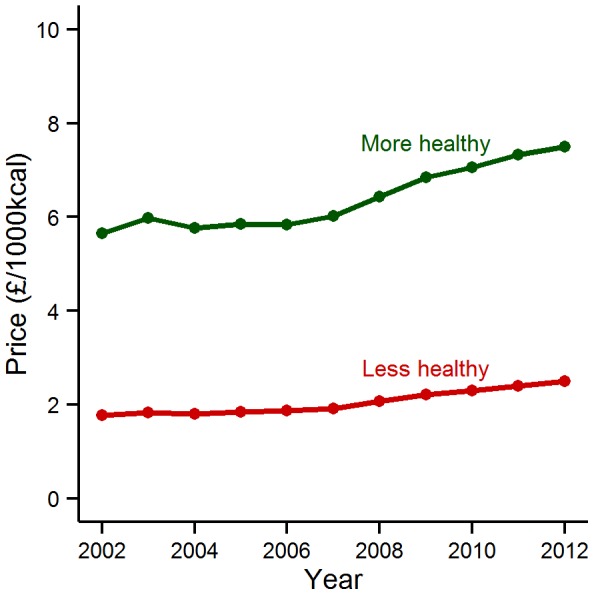
Results: The mean (standard deviation) 2012 price/1000 kcal was £2.50 (0.29) for less healthy items and £7.49 (1.27) for more healthy items. The ANOVA results confirmed that all prices had risen over the period 2002-2012, but more healthy items rose faster than less healthy ones in absolute terms:£0.17 compared to £0.07/1000 kcal per year on average for more and less healthy items, respectively (p<0.001).
Conclusions: Since 2002, more healthy foods and beverages have been consistently more expensive than less healthy ones, with a growing gap between them. This trend is likely to make healthier diets less affordable over time, which may have implications for individual food security and population health, and it may exacerbate social inequalities in health. The novel data linkage employed here could be used as the basis for routine food price monitoring to inform public health policy.
Conflict of interest statement
Figures
References
-
- World Health Organization (2004) Global Strategy on Diet, Physical Activity and Health. Geneva.
-
- National Health Service. The Eatwell Plate. Available: http://www.nhs.uk/Livewell/Goodfood/Pages/eatwell-plate.aspx. Accessed 2013 Jun 30.
-
- Department of Health (2012) National Diet and Nutrition Survey: headline results from Years 1, 2 and 3. London.
-
- Murray CJL, Richards MA, Newton JN, Fenton KA, Anderson HR, et al. (2013) UK health performance: findings of the Global Burden of Disease Study 2010. Lancet 381: 997–1020. - PubMed
Publication types
MeSH terms
Grants and funding
LinkOut - more resources
Full Text Sources
Other Literature Sources
Miscellaneous
