. 2016 Mar;68(2):203-11.
doi: 10.1007/s10616-014-9769-1. Epub 2014 Oct 9.

Fluorescent labeling for clonal selection of Marc 145 cells secreting high levels of recombinant protein PBD-1

Affiliations

Fluorescent labeling for clonal selection of Marc 145 cells secreting high levels of recombinant protein PBD-1

Hai-Jun Huang et al. Cytotechnology. 2016 Mar.

Abstract

Despite the powerful impact gene expression markers like the green fluorescent protein (GFP) or enhanced GFP (EGFP) exert on linking the expression of recombinant protein for selection of high producers in recent years, there is still a strong incentive to develop more economical and efficient methods for isolating mammalian cell clones secreting high levels of recombinant proteins. Here we present a new method based on the co-expression of EGFP that allows clonal selection in standard 96-well cell culture plates. The genes encoding the EGFP protein and the related protein are linked by an internal ribosome entry site and thus are transcribed into the same mRNA in an independent translation process. Since both proteins arise from a common mRNA, the EGFP expression level correlates with the expression level of the therapeutic protein in each clone. By expressing recombinant porcine β-defensin 1 in Marc 145 cells, we demonstrate the robustness and performance of this technique. The method can be served as an alternative to identify high-producer clones with various cell sorting methods.

Keywords: High producer; Mammalian cell culture; Porcine β-defensin l; Recombinant protein.


Figures

Fig. 1
Fig. 1
Construction of the eukaryotic expression vector of the PBD-1 gene. a Schematical representation of the construction of the eukaryotic expression vector of the PBD-1 gene. b Agarose electrophoresis of PCR products. M, DL 2000 marker
Fig. 2
Fig. 2
The screening of stable transfected cell clones. AD, top panels, bright field images; lower panels, fluorescent images. a, one cell; b, two cells; c, one clone cluster; d, stable cell line. Scale bar, 100 μm
Fig. 3
Fig. 3
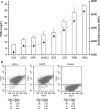
a Correlation between EGFP and PBD-1 expression in a number of high-producer clones. Prior to measurements, clones exhibiting high EGFP fluorescence were transferred to 24-well plates and cultured for 10 days in protein-free medium. The PBD-1 concentration in the cell culture supernatant was analysed by ELISA and the EGFP fluorescence signal was measured optically. The EGFP fluorescence is given as relative fluorescence unit (RFU) after deduction of BFplate (background fluorescence of transparent microtitre plate). Data shown are representative of results in three independent experiments. b The fluorescence signal of EGFP-expressing Marc 145 cells was analyzed by flow cytometry with a FACScan flow cytometer. Histograms show fluorescence intensity versus cell number for each well indicated. Untransfected Marc 145 cells were used as a control
Fig. 4
Fig. 4
Time course of PBD-1 and EGFP concentration during spinner flask batch culture of the clone 9/D6. The PBD-1-expressing cell line 9/D6 was cultured into a spinner flask. The cells were inoculated at a density of 5 × 105 cells/mL in 100 mL DMEM medium on day 0 and cultured for 14 days. The PBD-1 concentrations were measured by ELISA and are indicated by black triangles. The EGFP production was measured optically and the values obtained were converted into μg/L EGFP produced using a standard curve established with pure EGFP. The EGFP concentrations are indicated by black squares. Data shown are representative of results in three independent experiments
Fig. 5
Fig. 5
High-producing Marc 145 cell clones under fluorescence microscope. ac present three typical PBD-1-producing cell clones; upper panel, bright field images; lower panel, fluorescent images. Scale bar100 lm
Fig. 6
Fig. 6
a Southern blot analysis of genomic DNA from stably PBD-1-transfected cells. b Representative Western blots for PBD-1 and EGFP. GAPDH was used as a loading control. These subclones were lysed by lysing buffer after 10 days of culture and then were analyzed by Western blot. c Graphs representing the analysis of the Western blots for the analysed proteins PBD-1 and EGFP

References

    1. Bailey CG, Tait AS, Sunstrom NA. High-throughput clonal selection of recombinant CHO cells using a dominant selectable and amplifiable metallothionein-GFP fusion protein. Biotechnol Bioeng. 2002;80:670–676. doi: 10.1002/bit.10424. - DOI - PubMed
    1. Borth N, Zeyda M, Katinger H. Efficient selection of high- producing subclones during gene amplification of recomnant Chinese hamster ovary cells by flow cytometry and cell sorting. Biotechnol Bioeng. 2001;71:266–273. doi: 10.1002/1097-0290(2000)71:4<266::AID-BIT1016>3.0.CO;2-2. - DOI - PubMed
    1. Browne SM, Al-Rubeai M. Selection methods for high-producing mammalian cell-lines. Trends Biotechnol. 2007;25:425–432. doi: 10.1016/j.tibtech.2007.07.002. - DOI - PubMed
    1. Caroll S, Al-Rubeai M. ACSD labelling and magnetic cell separation: a rapid method of separating antibody secret- ing cells from non-secreting cells. J Immunol Methods. 2005;296:171–178. doi: 10.1016/j.jim.2004.11.007. - DOI - PubMed
    1. Cubbitt AB, Heim R, Adams SR, Boyd AE. Understanding, improving and using green fluorescent proteins [J] Trends Biochem Sci. 1995;20:448–455. doi: 10.1016/S0968-0004(00)89099-4. - DOI - PubMed

LinkOut - more resources