. 2014 Oct 8;34(41):13629-43.
doi: 10.1523/JNEUROSCI.1353-14.2014.

Alzheimer's disease-like pathology induced by amyloid-β oligomers in nonhuman primates

Affiliations

Alzheimer's disease-like pathology induced by amyloid-β oligomers in nonhuman primates

Leticia Forny-Germano et al. J Neurosci. .

Erratum in

Abstract

Alzheimer's disease (AD) is a devastating neurodegenerative disorder and a major medical problem. Here, we have investigated the impact of amyloid-β (Aβ) oligomers, AD-related neurotoxins, in the brains of rats and adult nonhuman primates (cynomolgus macaques). Soluble Aβ oligomers are known to accumulate in the brains of AD patients and correlate with disease-associated cognitive dysfunction. When injected into the lateral ventricle of rats and macaques, Aβ oligomers diffused into the brain and accumulated in several regions associated with memory and cognitive functions. Cardinal features of AD pathology, including synapse loss, tau hyperphosphorylation, astrocyte and microglial activation, were observed in regions of the macaque brain where Aβ oligomers were abundantly detected. Most importantly, oligomer injections induced AD-type neurofibrillary tangle formation in the macaque brain. These outcomes were specifically associated with Aβ oligomers, as fibrillar amyloid deposits were not detected in oligomer-injected brains. Human and macaque brains share significant similarities in terms of overall architecture and functional networks. Thus, generation of a macaque model of AD that links Aβ oligomers to tau and synaptic pathology has the potential to greatly advance our understanding of mechanisms centrally implicated in AD pathogenesis. Furthermore, development of disease-modifying therapeutics for AD has been hampered by the difficulty in translating therapies that work in rodents to humans. This new approach may be a highly relevant nonhuman primate model for testing therapeutic interventions for AD.

Keywords: Alzheimer's disease; amyloid-β oligomers; nonhuman primate; synapse loss; tau pathology.


Figures

Figure 1.
Figure 1.
AβOs diffuse and accumulate in the frontal cortex of rats. A, Chronogram representing the protocol for intracerebroventricular injections of AβOs in rats (n = 15, vehicle; n = 13 AβOs). B, Dot blot of homogenates from the frontal cortex of rats receiving intracerebroventricular injections of vehicle or AβOs (duplicate results from representative rats are shown). (C) Representative image of the frontal cortex of an AβO-injected rat demonstrates abundant NU4-immunoreative cells (n = 13). Scale bar, 250 μm. D, E, High-magnification images show that AβOs bind to cells with neuronal morphology, whereas no NU4 staining was observed in vehicle-injected rat brains (n = 13). Scale bar, 25 μm. F, Micrograph of the frontal cortex from a rat that received AβO injections show colocalization between cells stained for NeuN (green) and AβOs (red, NU4 antibody). Scale bar, 5 μm. G, confocal micrograph of the frontal cortex from a rat that received AβO injections show a GFAP-positive cell (green) also presenting NU4 labeling (red). Scale bar, 5 μm. H, I, Representative micrographs of thioflavin-S staining in the hippocampus of a rat injected with AβOs (H), and in the hippocampus of the APP/PS1 mouse. Scale bar, 500 μm; inset, 50 μm; I). Scale bar (in H), 100 μm. J, NU4 labeling in the frontal cortex of the APPSwe,PS1ΔE9 transgenic mouse reveals abundant amyloid plaques (red). Cell nuclei revealed by DAPI staining. Scale bar, 500 μm.
Figure 2.
Figure 2.
AβOs diffuse and accumulate in the frontal cortex of macaques. A, B, Chronogram representing the administration and amount of injections of AβOs in macaques (n = 3 sham; n = 4 AβOs). C, AβO binding (red) in the frontal cortex of a macaque that received AβO injections. No AβO immunostaining was detected in the frontal cortex of the sham-operated macaques. Scale bar, 25 μm. D, Micrographic reconstruction of a section through the frontal cortex from a macaque that received intracerebroventricular injections of AβOs labeled with NU4 (red). Cell nuclei are labeled by DAPI. Neocortical layers I–VI and white matter (WM) are indicated. Right, High-magnification image of layers III–V, demonstrating the presence of AβO-positive cells (NU4 antibody, red; Lambert et al., 2007). Scale bar, 100 μm. E, Confocal micrograph of the frontal cortex from a macaque that received AβO injections shows colocalization between a cell stained for GFAP (green) and AβOs (red, NU4 antibody). Scale bar, 10 μm. F, Representative micrographs of the frontal cortex of macaques demonstrate the pattern of immunolabeling using and the anti-oligomer antibody NU4 and the anti-Aβ antibodies 4G8 and 6E10.
Figure 3.
Figure 3.
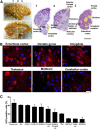
AβOs distribute into distinct brain areas and act as pathogenic ligands in macaques. A, Left, Lateral and sagittal view of the brain of a macaque that received intracerebroventricular injections of AβOs. White dashed lines indicate the regions where slices were obtained to analyze different regions (colored in yellow in coronal slices on the right). Scale bar, 1 cm. B, Representative micrographs images of macaque brains regions immunostained for AβOs. AβOs were labeled using the NU4 anti-oligomer antibody (red, Lambert et al., 2007) and cell nuclei were labeled with DAPI. Scale bar, 20 μm. C, Semiquantitative analysis of AβO-positive cells in different brain regions (n = 3). Error bars are ± SEM. Enth ctx, Enthorinal cortex; DG, dentate gyrus; Amy, amygdala; Occip ctx, occiptal cortex; Thal, thalamus; Ret Nucl, reticular nucleus; Cereb Ctx, cerebellar cortex.
Figure 4.
Figure 4.
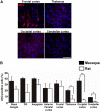
AβOs distribution in the rat brain. A, Representative images of brains regions with AβO-positive neurons (red) in rats. Cell nuclei were labeled with DAPI. Scale bar, 20 μm. B, Semiquantitative comparative analysis of AβO-positive cells in distinct brain regions analyzed in rats (n = 4) and macaques (n = 4) that received intracerebroventricular injections of AβOs. DG, Dentate gyrus of hippocampus. Bars represent averages ± SEM. Student's t test; *p < 0.05; **p < 0.01.
Figure 5.
Figure 5.
AβOs trigger tau phosphorylation in the rat and macaque brains. A, Representative micrographs showing tau-pSer396 immunofluorescence (green) and DAPI in the frontal cortex, dentate gyrus of the hippocampus and amygdalar complex in a sham-operated macaque and in a macaque that received intracerebroventricular injections of AβOs. Scale bar, 25 μm. Graphs show quantification of tau-pSer396 optical densities using DAB immunostaining (see Material and Methods) of frontal cortex, dentate gyrus, and amygdalar complex. B, Representative micrographs of tau-pSer396 (green) immunofluorescence in the frontal cortex of rats that received intracerebroventricular injection of vehicle or AβOs (n = 4/group). Scale bar, 50 μm. C, Representative micrographs of the midbrain of a sham-operated macaque and a macaque that received AβO injections showing tau-pSer396 immunofluorescence. Scale bar, 50 μm. Quantification of tau-pSer396 densities using DAB immunostaining. Symbols represent the average values for each macaque. All error bars are ± SEM; **p < 0.01, Student's t test. D, Western blot probed with anti-tau pSer396 revealed enhanced tau phosphorylation (∼64 kDa) in all AβO-injected macaques compared with control macaque brains (green arrow); the presence of high molecular mass phospho-tau-reactive bands (>150 kDa) in brain extracts from the frontal cortex of AβO-injected macaques (red arrow). In addition, two low molecular mass phosphorylated tau fragments (<20 kDa) were observed only in brain extracts from AβO-injected macaques (purple arrow). A similar labeling profile between control and AβO-injected macaques was observed when the same membrane was probed with the anti-Tau5 antibody.
Figure 6.
Figure 6.
Detection of neurofibrillary tangles markers in the brains of AβO-injected macaques. A, Representative micrographs showing AT100 immunostaining (phospho-tau at Ser212 and Thr214) in the frontal cortex, dentate gyrus and amygdalar complex from one sham-operated macaque and one AβO-injected macaque. Scale bar, 50 μm. B, Quantification of AT100 optical densities using DAB immunostaining in the frontal cortex, dentate gyrus, and amygdalar complex. C, Representative micrographs showing CP13 immunofluorescence in the frontal cortex, dentate gyrus, and amygdalar complex from one sham-operated macaque and one AβO-injected macaque. Scale bar, 50 μm. D, Quantification of CP13 positive cells in the frontal cortex, dentate gyrus, and amygdala. Symbols represent the average values for each macaque (n = 3sham; n = 4 AβO). All error bars are ± SEM; *p < 0.05, **p < 0.01, Student′s t test. OD, Optical density.
Figure 7.
Figure 7.
AβOs induce neurofibrillary tangle formation in the brains of macaques. A, Thioflavin-S staining in the frontal cortex of macaques indicates neurofibrillary tangles formation in neurons of the frontal cortex. Scale bar, 100 μm. Optical zoom images of selected thioflavin S-positive neurons in AβO macaque (red dashed rectangles), no thioflavin-S staining was detected in the sham-operated macaques. Scale bar, 5 μm. Representative immunofluorescence of Alz50 (B), PHF-1 (C), and AT8 (D) reveals the presence of tangles in the frontal cortex of an AβO-injected macaque. Immunogold electron microscopy in the frontal cortex of a AβO-injected macaque using conformational antibodies MC-1 (E), Alz50 (F), and PHF-1 for phospho-tau Ser306 and Ser404 (G). Scale bar, 50 nm. The ultrastructure in high-magnification reveals straight tau filaments that resemble neurofibrillary tangles described in transgenic mice (Ramsden et al., 2005; Oddo et al., 2007) and AD brain (Thorpe et al., 2001; Rissman et al., 2004). Arrowheads point to MC-1, Alz-50, and PHF-1 labeling. Scale bar, 50 nm. Thio S, Thioflavin S.
Figure 8.
Figure 8.
Amyloid-β oligomers induce astrocyte activation in the brains of macaques. A, Representative micrographs showing GFAP immunostaining in the frontal cortex, dentate gyrus and amygdalar complex of a sham-operated macaque and an AβO-injected macaque. Scale bar, 50 μm. B, Quantification of GFAP optical densities by DAB immunostaining. Symbols represent the average values for each macaque. All error bars are ±SEM; *p < 0.05, Student's t test. OD, Optical density.
Figure 9.
Figure 9.
AβOs induce microglial activation in the brains of macaques. A, Representative micrographs showing Iba-1 DAB immunostaining in the frontal cortex, dentate gyrus, and amygdalar complex of a sham-operated macaque and an AβO-injected macaque. Scale bar, 50 μm. B, Quantification of Iba-1 positive cells. Symbols represent the average values for each macaque. All error bars are ±SEM; *p < 0.0, Student's t test. IBA-1, Ionized calcium-binding adapter molecule 1.
Figure 10.
Figure 10.
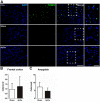
AβOs do not induce apoptosis in the brains of macaques. A, Representative images of TUNEL staining in the frontal cortex of macaques; experimental conditions as indicated. DNase I was used as a positive control (see Materials and Methods). Scale bar, 100 μm. Optical zoom images of selected regions are also presented. Scale bar, 50 μm. B, C, Quantification of TUNEL-positive cells in the frontal cortex and amygdala in sham-operated macaques and AβO-injected macaques.
Figure 11.
Figure 11.
AβOs trigger synapse loss in macaques. A, Representative micrographs showing synaptophysin immunostaining in frontal cortex and (B) PSD-95 immunostaining in amygdala of the sham-operated macaque and a macaque injected with AβOs. Scale bar, 50 μm. Graphs show quantification of synaptophysin and PSD-95 by optical densities from DAB immunostaining. Representative micrographs of synaptophysin (SYP; C) and PSD-95 (D) immunofluorescence in the frontal cortex of macaques. Graphs represent quantification of synaptophysin and PSD-95 puncta. Symbols represent the average values for each macaque. E, Representative micrographs of electron microscopy. Red arrows indicate regions identified as synapses (presence of postsynaptic density opposed to a presynaptic specialization). Graph represents quantification of the total number of synapses. Graph represents mean ± SEM (n = 3 sham; n = 4 AβO). All error bars are ± SEM; *p < 0.05, **p < 0.01, ***p < 0.001, Student's t test.

References

    1. Bomfim TR, Forny-Germano L, Sathler LB, Brito-Moreira J, Houzel JC, Decker H, Silverman MA, Kazi H, Melo HM, McClean PL, Holscher C, Arnold SE, Talbot K, Klein WL, Munoz DP, Ferreira ST, De Felice FG. An anti-diabetes agent protects the mouse brain from defective insulin signaling caused by Alzheimer's disease- associated Abeta oligomers. J Clin Invest. 2012;122:1339–1353. doi: 10.1172/JCI57256. - DOI - PMC - PubMed
    1. Braak H, Braak E. Neuropathological stageing of Alzheimer-related changes. Acta Neuropathol. 1991;82:239–259. doi: 10.1007/BF00308809. - DOI - PubMed
    1. Braak H, Thal DR, Ghebremedhin E, Del Tredici K. Stages of the pathologic process in Alzheimer disease: age categories from 1 to 100 years. J Neuropathol Exp Neurol. 2011;70:960–969. doi: 10.1097/NEN.0b013e318232a379. - DOI - PubMed
    1. Bramblett GT, Goedert M, Jakes R, Merrick SE, Trojanowski JQ, Lee VM. Abnormal tau phosphorylation at Ser396 in Alzheimer's disease recapitulates development and contributes to reduced microtubule binding. Neuron. 1993;10:1089–1099. doi: 10.1016/0896-6273(93)90057-X. - DOI - PubMed
    1. Chabrier MA, Blurton-Jones M, Agazaryan AA, Nerhus JL, Martinez-Coria H, LaFerla FM. Soluble abeta promotes wild-type tau pathology in vivo. J Neurosci. 2012;32:17345–17350. doi: 10.1523/JNEUROSCI.0172-12.2012. - DOI - PMC - PubMed

Publication types

MeSH terms

LinkOut - more resources