. 2014 Oct 8;34(41):13757-67.
doi: 10.1523/JNEUROSCI.2106-14.2014.

The amygdala and basal forebrain as a pathway for motivationally guided attention

Affiliations

The amygdala and basal forebrain as a pathway for motivationally guided attention

Christopher J Peck et al. J Neurosci. .

Abstract

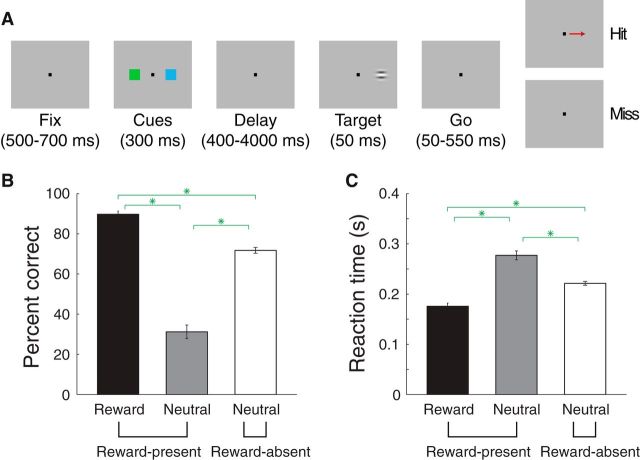
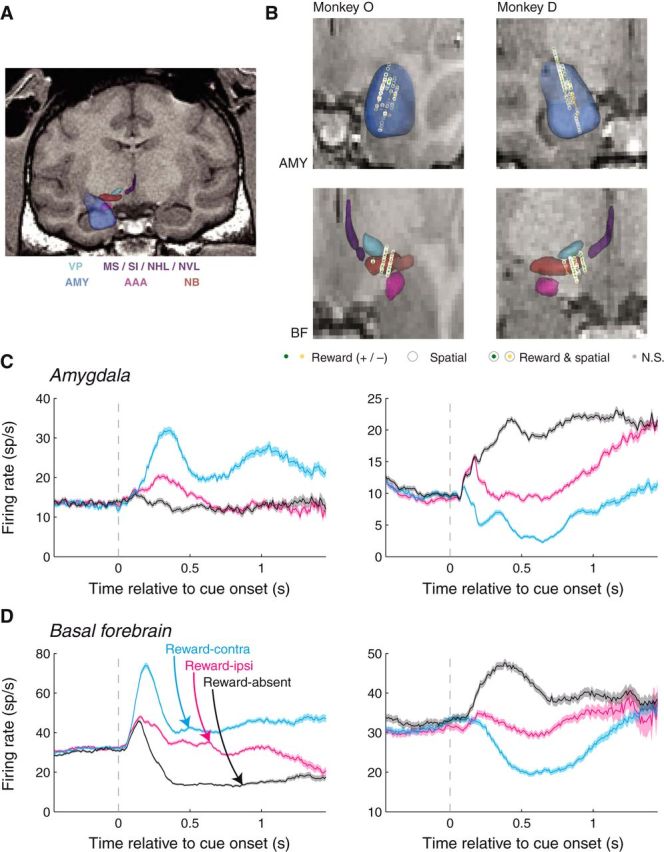
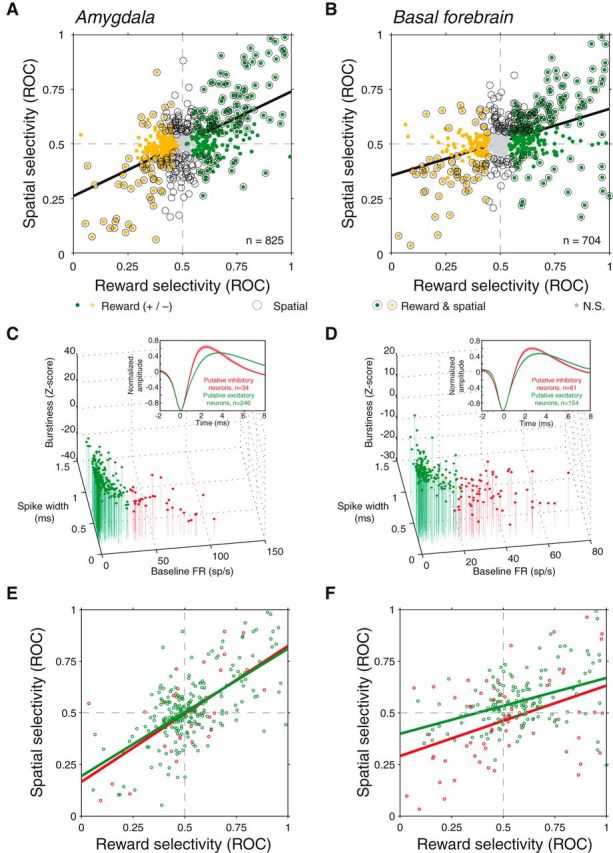
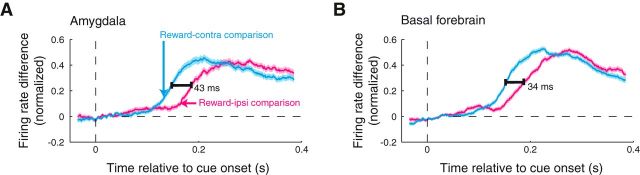
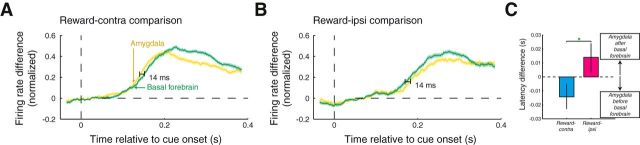
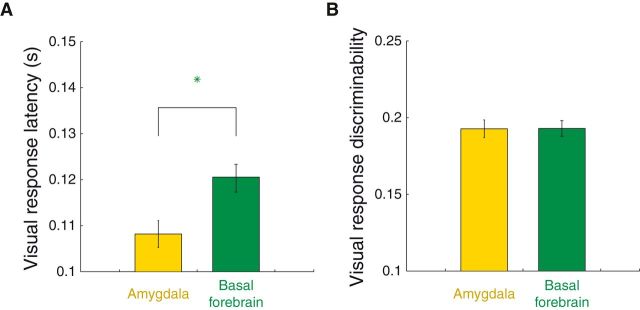
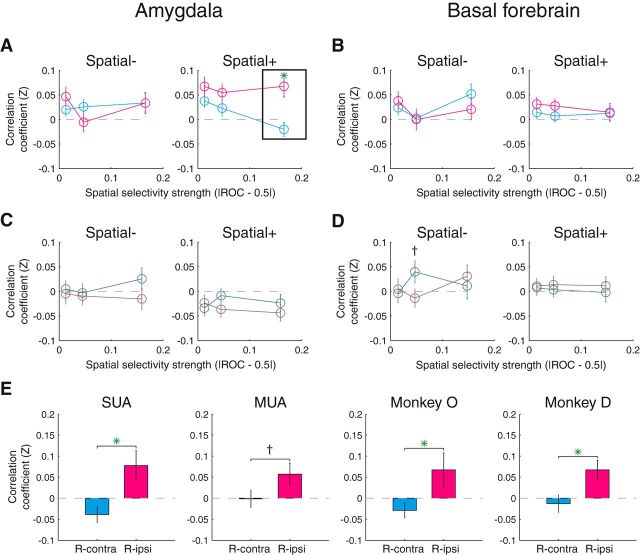
Visual stimuli associated with rewards attract spatial attention. Neurophysiological mechanisms that mediate this process must register both the motivational significance and location of visual stimuli. Recent neurophysiological evidence indicates that the amygdala encodes information about both of these parameters. Furthermore, the firing rate of amygdala neurons predicts the allocation of spatial attention. One neural pathway through which the amygdala might influence attention involves the intimate and bidirectional connections between the amygdala and basal forebrain (BF), a brain area long implicated in attention. Neurons in the rhesus monkey amygdala and BF were therefore recorded simultaneously while subjects performed a detection task in which the stimulus-reward associations of visual stimuli modulated spatial attention. Neurons in BF were spatially selective for reward-predictive stimuli, much like the amygdala. The onset of reward-predictive signals in each brain area suggested different routes of processing for reward-predictive stimuli appearing in the ipsilateral and contralateral fields. Moreover, neurons in the amygdala, but not BF, tracked trial-to-trial fluctuations in spatial attention. These results suggest that the amygdala and BF could play distinct yet inter-related roles in influencing attention elicited by reward-predictive stimuli.

Keywords: amygdala; attention; basal forebrain; emotion.


Figures

Figure 1.
Figure 1.
Stimulus–reward associations bias spatial attention. A, Detection task. B, Percentage correct when the target appeared either at the reward cue location (black) or the neutral cue location on reward-present trials (gray) or on reward-absent trials (white). Green stars indicated significant comparisons (paired Wilcoxon, p < 10−8). C, Reaction time plotted in the same format as B.
Figure 2.
Figure 2.
MRI reconstruction of recording sites and individual neuron firing rates. A, Sample coronal slice from Monkey D with overlaid 3D reconstructions of the brain areas of interest, as well as nearby brain areas. Light blue: ventral pallidum (VP); purple: medial septal nucleus (MS), substantia innominata (SI), nucleus of the horizontal limb of the diagonal band (NHL), and nucleus of the vertical limb of the diagonal band (NVL); blue: amygdala (AMY); magenta: anterior amygdaloid area (AAA); brown: nucleus basalis (NB). B, Recording locations within the amygdala (top) and BF (bottom) for the two monkeys. Plot style indicates the significance of selectivity for individual sites (see legend). C, D, Amygdala and BF neurons respond selectivity to cues depending upon their reward association and spatial configuration. Firing rates as a function of time relative to cue onset for example amygdala (C) and BF (D) neurons. For each example (SUA) site, both the reward prediction and spatial configuration of the cues had a significant influence on firing rates (Wilcoxon, p < 0.05; left, reward and spatial selectivity indices > 0.5; right, reward and spatial selectivity indices < 0.5).
Figure 3.
Figure 3.
Reward and spatial selectivity are correlated in a similar manner in amygdala and BF and among putative excitatory and inhibitory neurons. A, Reward selectivity and spatial selectivity indices are positively correlated for amygdala neurons (p < 10−66). Plot style indicates the significance of each (see legend). B, Reward selectivity and spatial selectivity indices are positively correlated for BF neurons (p < 10−32). C, D, Classification of neurons based on baseline firing rate, spike width, and burstiness. A k-means algorithm was used to divide the population of amygdala (C) and BF (D) neurons into putative excitatory (green) and inhibitory (red) neurons. Insets, Population average waveforms for each group; waveforms were valley normalized before averaging and the shaded region indicates the SE across neurons. E, F, Relationship between reward and spatial selectivity as in A and B for putative excitatory (green) and inhibitory (red) neurons. Regressions were significant in each case (p < 0.001).
Figure 4.
Figure 4.
Contralateral reward information appears earlier than ipsilateral reward information in amygdala and BF. A, Population reward-contra (cyan) and reward-ipsi (magenta) discrimination curves as function of time relative to cue onset for amygdala sites. Firing rate differences were peak normalized and sign corrected before averaging over recording sites. The optimal time shift between the curves was determined using data within 50–400 ms after cue onset; an extended time window is plotted only for display purposes. B, Same as A for the BF sites. Latencies differed significantly for each brain area (p < 10−3).
Figure 5.
Figure 5.
Latency of reward information differs between the amygdala and BF. A, Reward-contra comparison as function of time relative to cue onset for amygdala sites (yellow) and BF sites (green). Firing rate differences were peak normalized and sign corrected before averaging over recording sites. The optimal time shift between the curves was determined using data within 50–400 ms after cue onset; an extended time window is plotted only for display purposes. B, Same as A for the reward-ipsi comparison. Here, the optimal time shift was determined using data within 90–440 ms after cue onset. Latency differences were significant in each case (p < 0.05). C, Latency differences for contralateral and ipsilateral reward information compared between the amygdala and BF. Error bars indicate the 95% confidence intervals of the latency differences. Green asterisk indicates the significance of the comparison (p < 0.05).
Figure 6.
Figure 6.
Visual responses occur earlier in the amygdala than the BF. A, Mean visual response latencies on reward-contra trials (489 amygdala sites, 523 BF sites). Error bars indicate SE across neurons; green stars denote significant differences across brain area (Wilcoxon, p < 0.05). B, Same format and sample as A where the y-axis is the absolute ROC value (relative to 0.5) comparing baseline firing rates (500 ms before cue onset) with cue-evoked firing rates (100–300 ms after cue onset).
Figure 7.
Figure 7.
The amygdala, but not the BF, exhibits a trial-by-trial correlation between firing rate and reaction time. A, Average correlation coefficients for amygdala sites with negative spatial selectivity (i.e., spatial selectivity index < 0.5; left) and positive spatial selectivity (i.e., spatial selectivity index > 0.5; right) for reward-contra (cyan) and reward-ipsi trials (magenta); x values are the mean strength of spatial selectivity (|ROC–0.5|) for each of the three groups. B, Same as A for BF sites. C, D, Same as A and B except that the data are from reward-absent trials (comparing contralateral and ipsilateral saccades). E, Data for the significant comparison (box in A) split by activity type and monkey. Green asterisks indicate significant comparison (t test, p < 0.05) and crosses indicate trend effects (p < 0.1).

References

    1. Amaral DG, Price JL. Amygdalo-cortical projections in the monkey (Macaca fascicularis) J Comp Neurol. 1984;230:465–496. doi: 10.1002/cne.902300402. - DOI - PubMed
    1. Anderson EB, Mitchell JF, Reynolds JH. Attentional modulation of firing rate varies with burstiness across putative pyramidal neurons in macaque visual area V4. J Neurosci. 2011;31:10983–10992. doi: 10.1523/JNEUROSCI.0027-11.2011. - DOI - PMC - PubMed
    1. Baizer JS, Desimone R, Ungerleider LG. Comparison of subcortical connections of inferior temporal and posterior parietal cortex in monkeys. Vis Neurosci. 1993;10:59–72. doi: 10.1017/S0952523800003229. - DOI - PubMed
    1. Barbas H, De Olmos J. Projections from the amygdala to basoventral and mediodorsal prefrontal regions in the rhesus monkey. J Comp Neurol. 1990;300:549–571. doi: 10.1002/cne.903000409. - DOI - PubMed
    1. Baxter MG, Murray EA. The amygdala and reward. Nat Rev Neurosci. 2002;3:563–573. doi: 10.1038/nrn875. - DOI - PubMed

Publication types

LinkOut - more resources