. 2014 Oct 9:5:5066.
doi: 10.1038/ncomms6066.

Pin1-dependent signalling negatively affects GABAergic transmission by modulating neuroligin2/gephyrin interaction

Affiliations

Pin1-dependent signalling negatively affects GABAergic transmission by modulating neuroligin2/gephyrin interaction

Roberta Antonelli et al. Nat Commun. .

Abstract

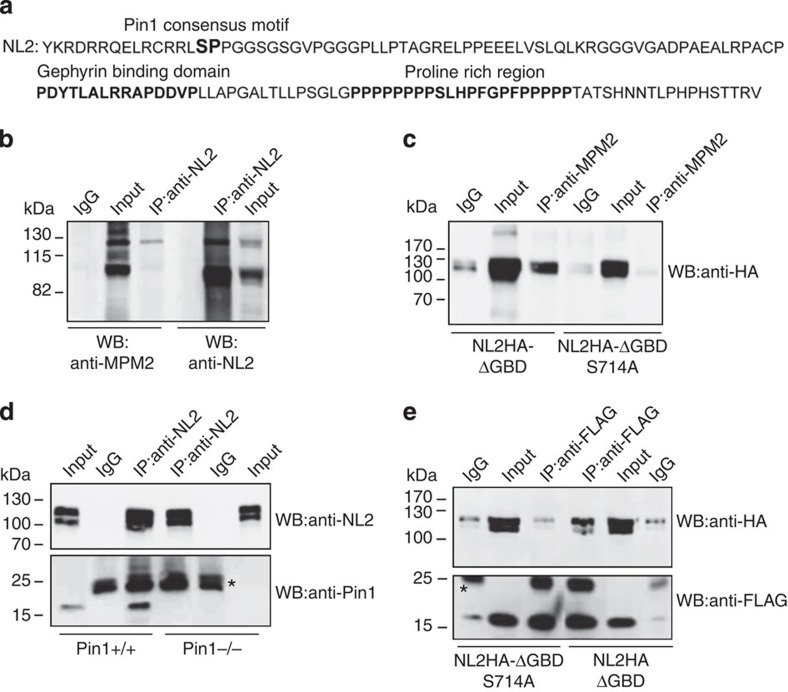
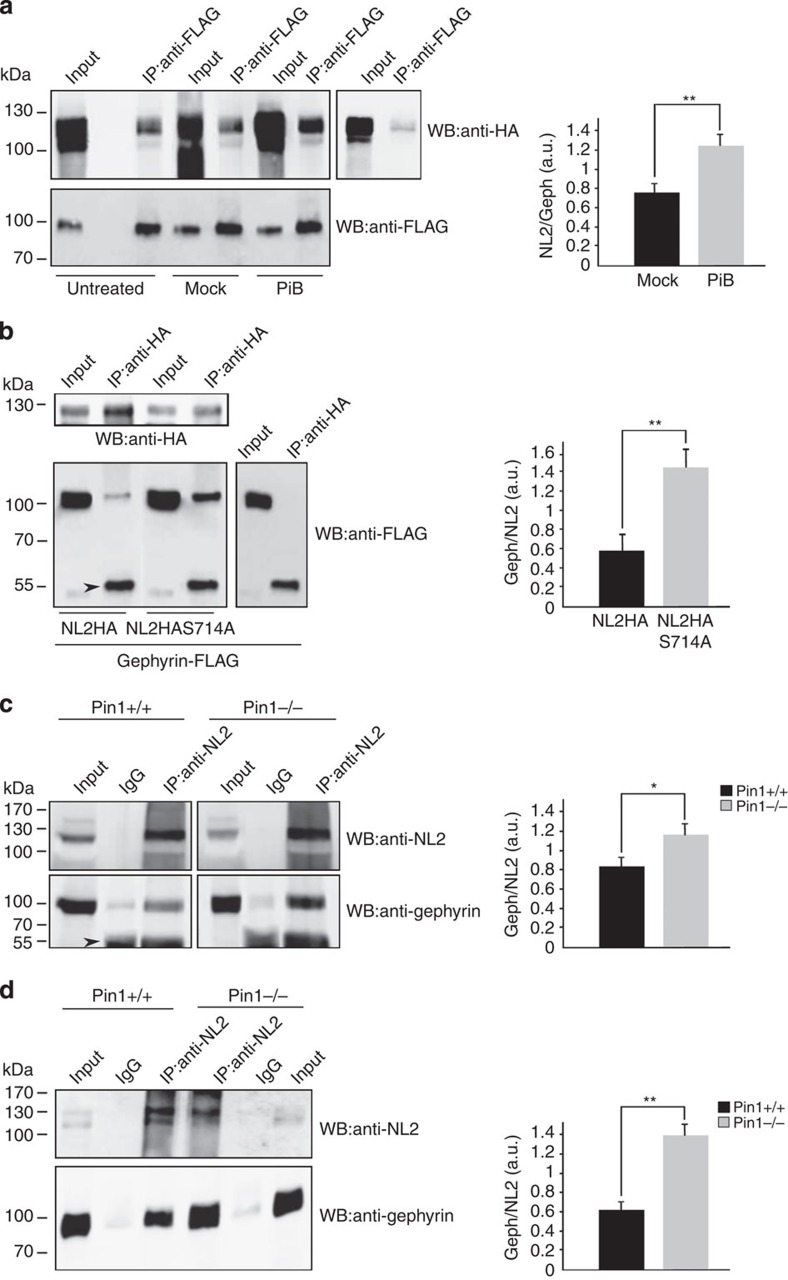
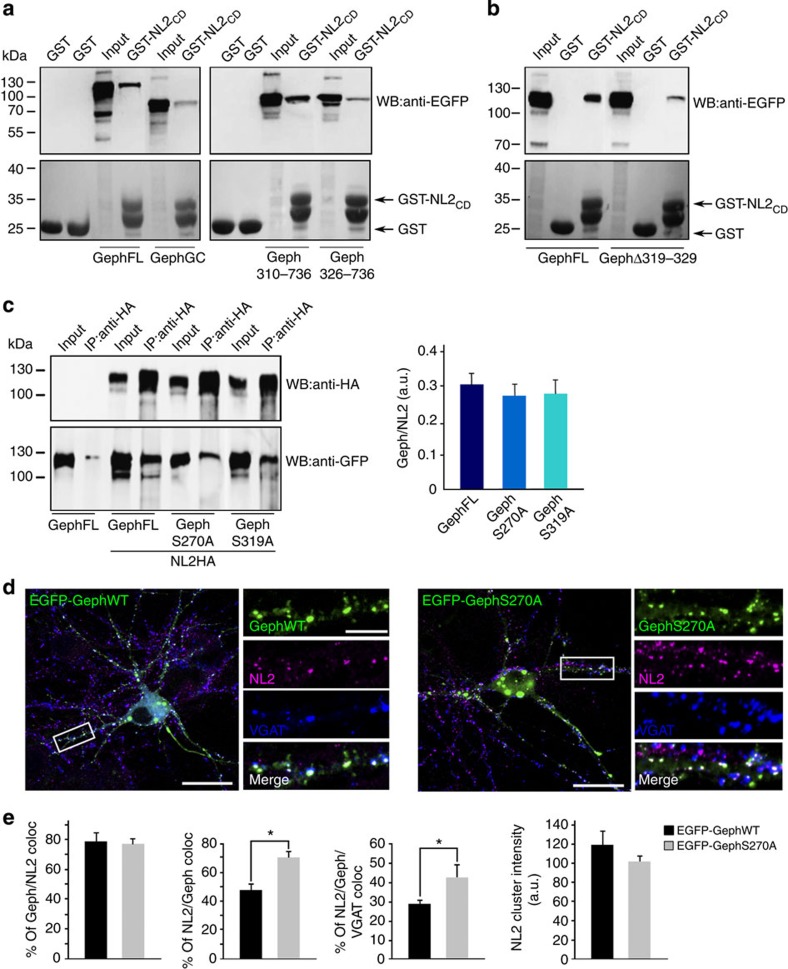
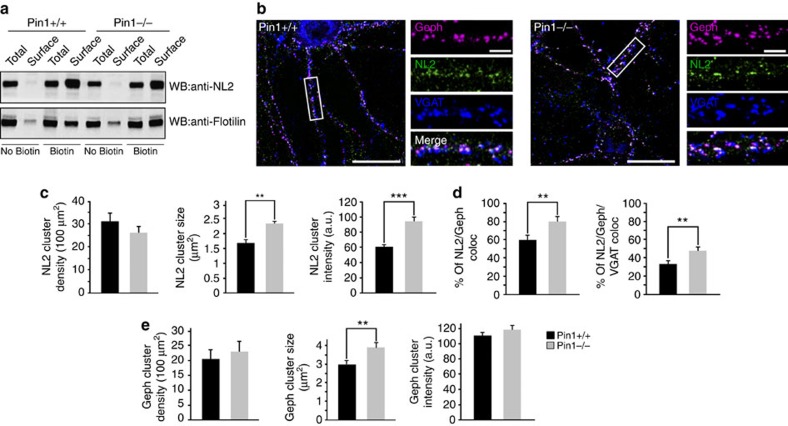
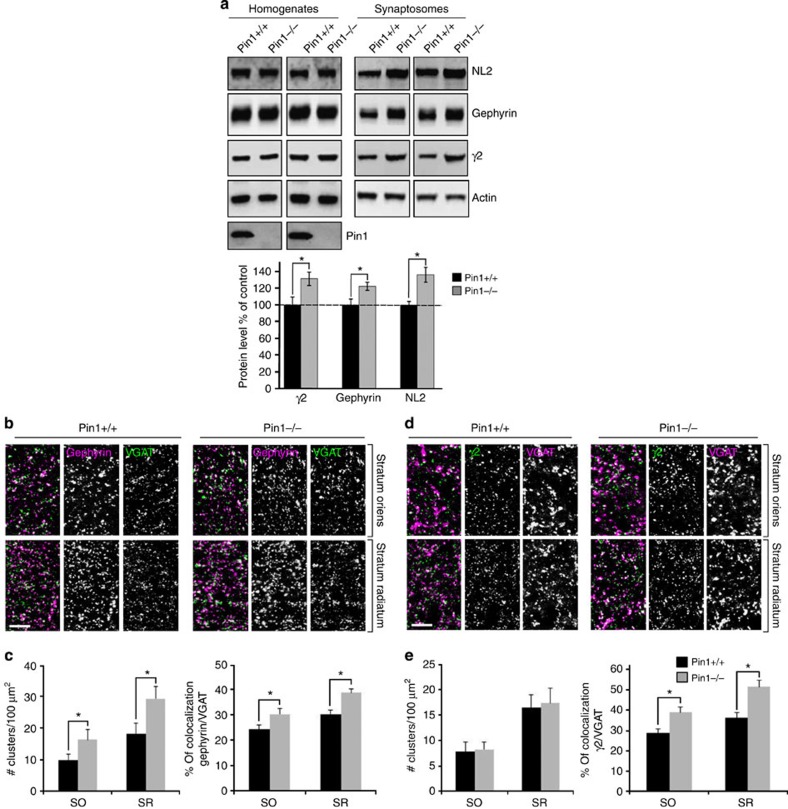
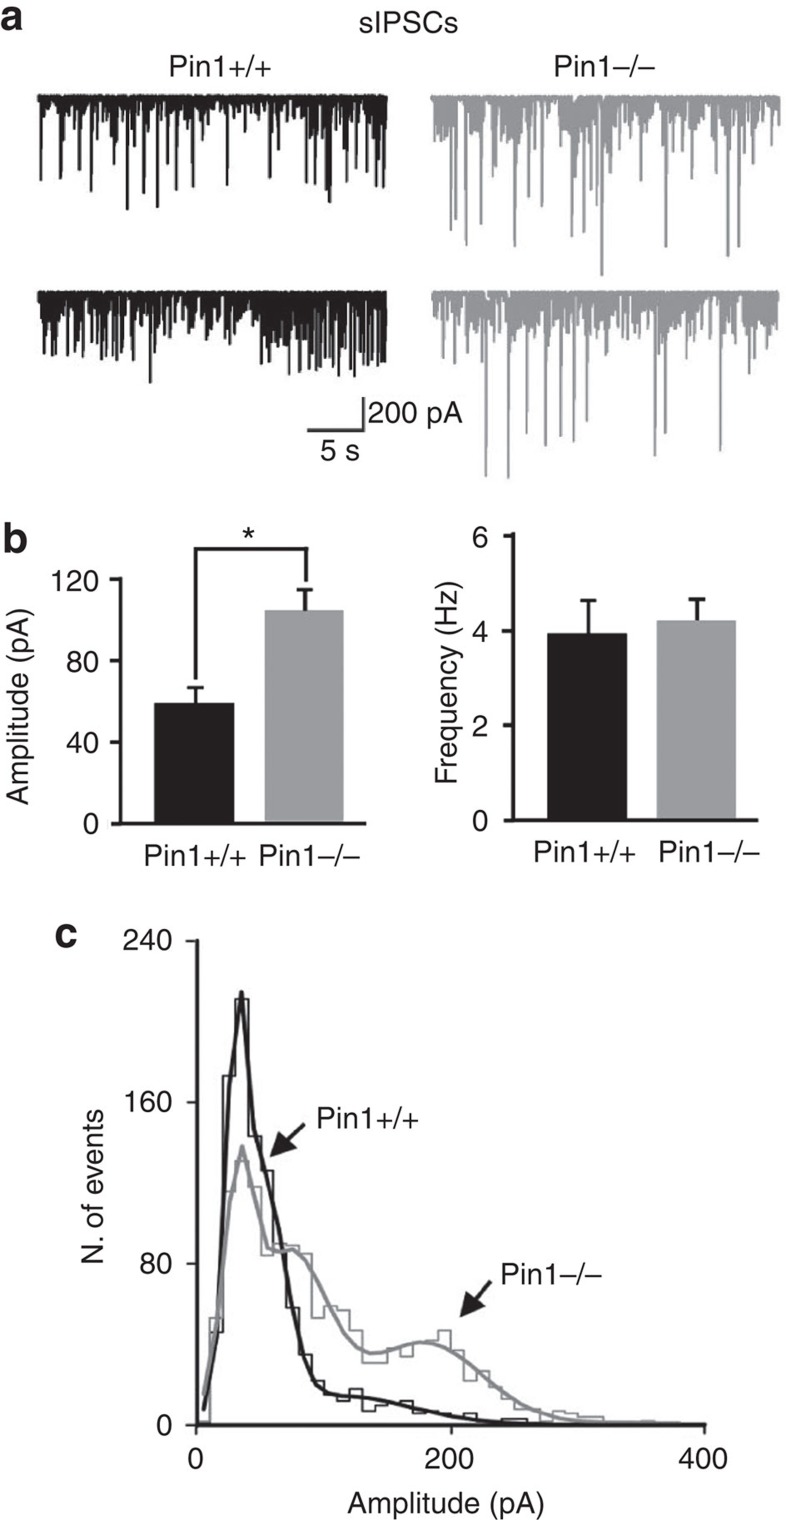
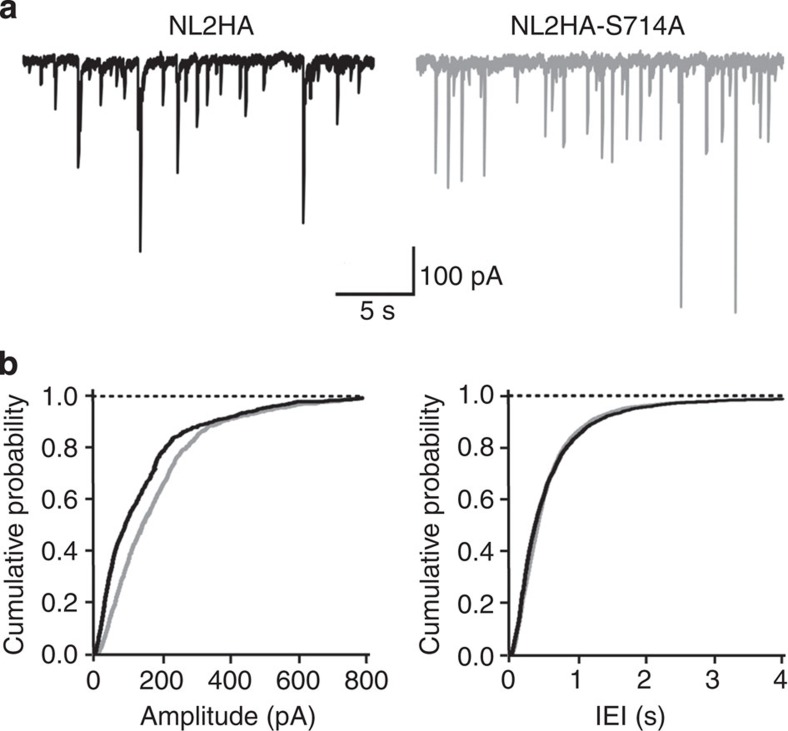
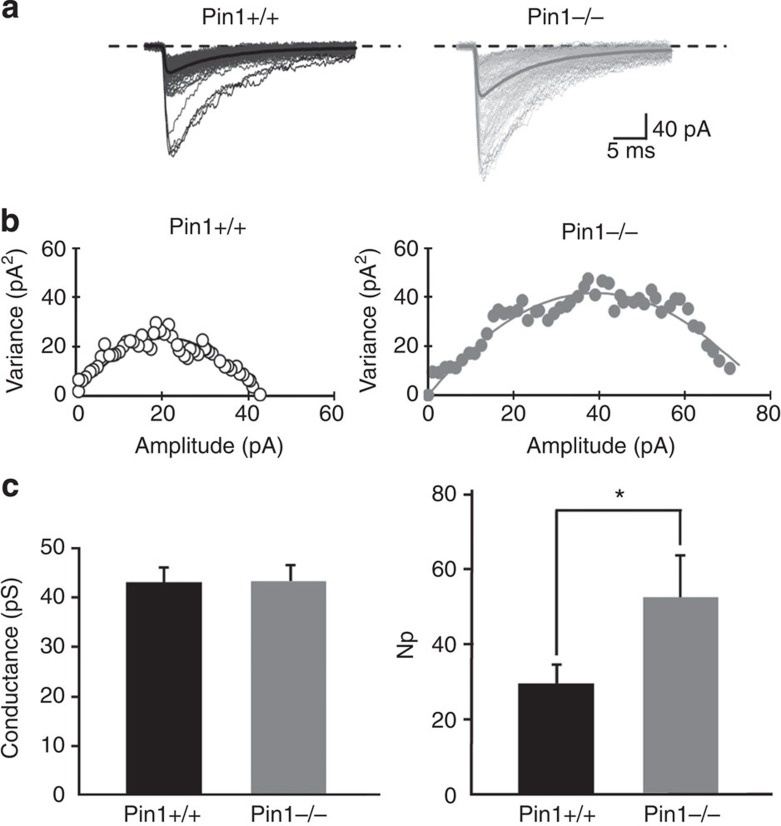
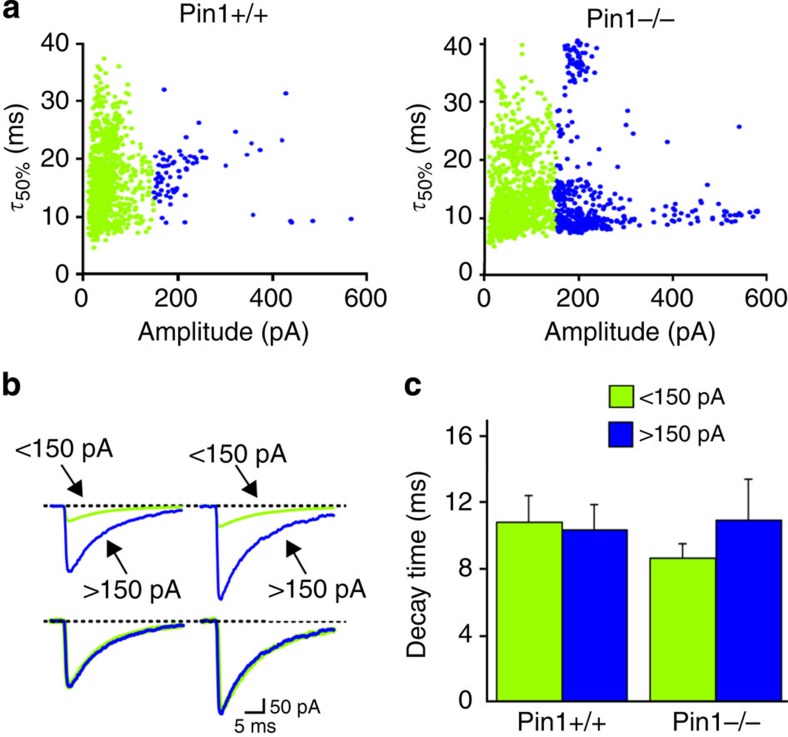
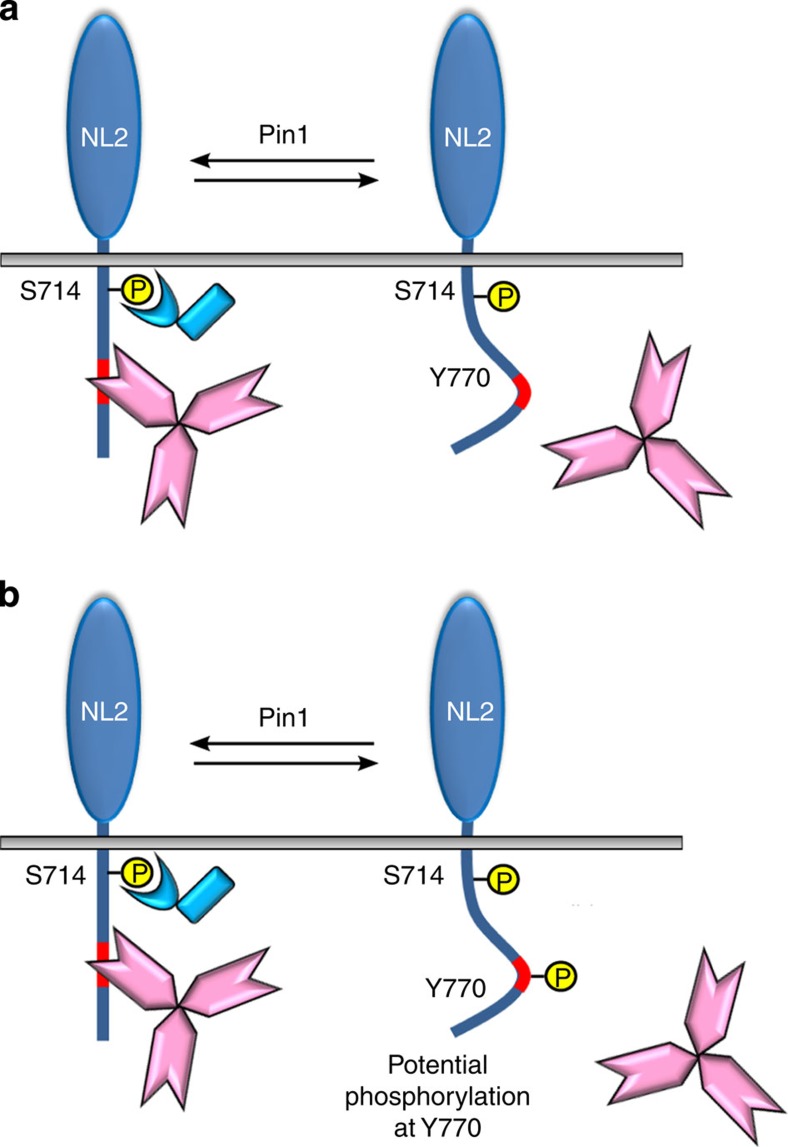
The cell adhesion molecule Neuroligin2 (NL2) is localized selectively at GABAergic synapses, where it interacts with the scaffolding protein gephyrin in the post-synaptic density. However, the role of this interaction for formation and plasticity of GABAergic synapses is unclear. Here, we demonstrate that endogenous NL2 undergoes proline-directed phosphorylation at its unique S714-P consensus site, leading to the recruitment of the peptidyl-prolyl cis-trans isomerase Pin1. This signalling cascade negatively regulates NL2's ability to interact with gephyrin at GABAergic post-synaptic sites. As a consequence, enhanced accumulation of NL2, gephyrin and GABAA receptors was detected at GABAergic synapses in the hippocampus of Pin1-knockout mice (Pin1-/-) associated with an increase in amplitude of spontaneous GABAA-mediated post-synaptic currents. Our results suggest that Pin1-dependent signalling represents a mechanism to modulate GABAergic transmission by regulating NL2/gephyrin interaction.


Figures

Figure 1
Figure 1. NL2 is a proline-directed substrate.
(a) Amino acid sequence of the NL2 CD. In bold is marked the unique Pin1 consensus motif (S714-P). The gephyrin-binding domain and the proline-rich region are highlighted in bold. (b) Representative immunoblotting of endogenous NL2 immunoprecipitated (IP) from mouse brain and probed with the anti-MPM2 that specifically recognizes phosphorylated S/T-P motifs and anti-NL2. Rabbit IgGs were used as negative control (IgG) (n=4). (c) Representative immunoblotting of overexpressed NL2HA lacking the gephyrin binding domain (NL2HA-ΔGBD) and the corresponding point mutant (NL2HA-ΔGBDSer714Ala) immunoprecipitated by the phospho-specific MPM2 antibody. Western blot analysis was carried out with anti-HA monoclonal antibody. Mouse IgGs were used as negative control (n=5). (d) Co-immunoprecipitation (Co-IP) of endogenous NL2 and Pin1 from DSP cross-linked brain homogenates of Pin1+/+ or Pin1−/− mice. Western blots were performed with anti-NL2 polyclonal and anti-Pin1 monoclonal antibodies. Mouse IgGs were used as negative control. Asterisk indicate the IgG light chains (n=6). (e) FLAG epitopes from cross-linked samples of HEK293 cells co-expressing Pin1-FLAG and NL2HA-ΔGBD or NL2HA-ΔGBDS714 were immunoprecipitated by anti-FLAG antibody. Western blot was performed with anti-HA and anti-FLAG monoclonal antibodies. Mouse IgGs were used as negative control (n=4). Full images of western blots are in Supplementary Fig. 5.
Figure 2
Figure 2. Pin1 negatively modulates NL2/gephyrin interaction.
(a) Representative IP of FLAG epitopes from samples of HEK293 cells co-expressing gephyrin-FLAG and NL2HA and treated for 48 h with PiB 2.5 μM, DMSO (mock) or untreated. IP was also performed on NL2HA single transfected cells as a negative control. Nitrocellulose membranes were probed with anti-HA and anti-FLAG antibodies. The histogram on the right shows the relative amount of NL2 co-precipitated by gephyrin-FLAG in control and PiB treated cells obtained from densitometric analysis (n=5, mean values±s.d., **P<0.001, Student’s t-test). (b) Lysates of HEK cells transfected with gephyrin-FLAG in the presence of NL2HA or NL2HA-S714A or with gephyrin alone (as a negative control) were immunoprecipitated with anti-HA agarose. Immunoprecipitates were analysed by western blotting using anti-FLAG and anti-HA monoclonal antibodies. Arrowhead indicates the IgG heavy chains. The histogram on the right shows the relative amount of gephyrin-FLAG in complex with either NL2HA or NL2HA-S714A co-precipitated by anti-HA agarose obtained from densitometric analysis (n=5, mean values±s.d., **P<0.001, Student’s t-test). (c) Co-IP of endogenous NL2/gephyrin complexes from DSP cross-linked brain homogenates of Pin1+/+ or Pin1−/− mice. Western blots were performed with anti-NL2 polyclonal and anti-gephyrin monoclonal antibodies. Rabbit IgGs were used as negative control. An increased amount of gephyrin co-precipitates in complex with NL2 in the absence of Pin1 expression. Arrowhead indicates the IgG heavy chains. The histogram on the right shows the relative amount (obtained from densitometric analysis) of endogenous gephyrin co-precipitated by endogenous NL2 from both mouse genotypes (n=8, mean values±s.d., *P<0.01, Student’s t-test). (d) A similar experiment described in c was carries out on hippocampus isolated from of Pin1+/+ or Pin1−/− mice. The histogram on the right shows the relative amount (obtained from densitometric analysis) of endogenous gephyrin co-precipitated by endogenous NL2 from both mouse genotypes (n=4, mean values±s.d., **P<0.001, Student’s t-test). Full images of western blots are in Supplementary Fig. 5.
Figure 3
Figure 3. Impact of gephyrin S270A and S319A in NL2/gephyrin interaction.
(a) GST-NL2-CD pulldown from samples of HEK293 expressing EGFP-gephyrin full-length (FL), EGFP-gephyrin 310–736 (E-310), EGFP-gephyrin 326–736 (E-326) and EGFP-gephyrin GC. GST was used as negative control. Pulled down eGFPgephyrin variants were detected using an anti-GFP monoclonal antibody. The bottom panels show the levels of GST and GST-NL2-CD in the pulldown assays (Ponceau staining) (n=8). (b) EGFP-gephyrin Δ319 to 329 was tested in similar pulldown assays. Western blots in a and b were performed using anti-GFP antibody. Gephyrin requires amino acid sequence 319–329 for its efficient recruitment by NL2 (n=6). (c) Representative IP of HA epitopes from samples of HEK293 cells co-expressing NL2HA and EGFP-gephyrin WT, EGFP-gephyrinS270A or EGFP-gephyrinS319A. Nitrocellulose membranes were probed with anti-HA and anti-GFP antibodies. EGFP-gephyrin single transfected cells incubated with HA agarose were used as negative controls. The histogram on the right shows the relative amount of eGFP-gephyrinWT and point mutants co-precipitated by NL2HA (n=4, mean values±s.d., P>0.05). (d) Representative images of hippocampal neurons transfected with EGFP-gephyrin and EGFP-gephyrinS270A point mutant immunolabeled for endogenous NL2 (magenta) and VGAT (blue) at DIV10. Enlarged boxed areas are shown aside to the corresponding full view image. Post-synaptic clustering is demonstrated by apposition of gephyrin/NL2 clusters to VGAT positive terminals on the merge window. Scale bars, 20 μm in full view images and 5 μm in enlarged panels. (e) Distribution histograms of the % of gephyrin clusters colabeled with NL2 (79±5% in EGFP-gephyrinWT versus 77±4% in EGFP-gephyrinS270A), % of NL2 clusters colabeled with gephyrin (48±5% in EGFP-gephyrinWT versus 71±4% in EGFP-gephyrinS270A), % of NL2 synaptically localized (29±2% in EGFP-gephyrinWT versus 43±6% in EGFP-gephyrinS270A) and NL2 clusters intensity (119±15 a.u. in EGFP-gephyrinWT versus 102 a.u.±6 in EGFP-gephyrinS270A). The number of transfected hippocampal neurons investigated in each experiments (four independent experiments) were as follow: n=15 for eGFP-gephyrinWT, n=10 for eGFP-gepyrinS270A (for each neurons at least 4 dendritic regions of interests were measured, mean values±s.d., *P<0.01, Student’s t-test).
Figure 4
Figure 4. Pin1 enhances NL2 synaptic content not its surface abundance.
(a) Surface NL2 derived from cultured hippocampal neurons of Pin1+/+ and Pin1−/− mice was isolated by biotinylation assay and detected by anti-NL2 antibody. No biotinylated neuronal cells were processed in parallel to evaluate unspecific NL2 binding. Western blot detecting glycophosphatidylinositol-anchored Flotilin was used as loading control (n=4). Full images of western blots are in Supplementary Fig. 5. (b) Typical examples of hippocampal neurons from Pin1+/+ and Pin1−/− immunolabeled for endogenous gephyrin (magenta), NL2 (green) and VGAT (blue) at DIV10. Enlarged boxed areas are shown aside to the corresponding full view image. Post-synaptic clustering is demonstrated by apposition of gephyrin/NL2 clusters to VGAT positive terminals on the merge window. Scale bars, 20 μm in full view images and 5 μm in enlarged panels. (c) Distribution histograms of NL2 cluster density (normalized to 100 μm2), the average cluster size and intensity in Pin1+/+ and Pin1−/− hippocampal neurons. (d) Distribution histograms of the percentage of NL2 co-localizing with gephryin and the percentage of double labelled NL2/gephyrin puncta overlapping with the presynaptic marker VGAT. (e) Distribution histograms of gephyrin cluster density (normalized to 100 μm2), the average cluster size and intensity (calculated as described in c) in both mouse genotypes. The number of hippocampal neurons investigated in each experiments (three independent experiments) were as follows: n=10 for Pin1+/+, n=12 for Pin1−/−. For each neurons, at least five dendritic regions of interests were measured, mean values±s.d., **P<0.001, ***P<0.0001, Student’s t-test).
Figure 5
Figure 5. Synaptic enrichment of GABAARs is achieved in Pin1−/−.
(a) Representative immunoblots of NL2, gephyrin and γ2 subunit of GABAA receptor extracted from the hippocampus of Pin1+/+ and Pin1−/− mice (littermates) in two different sets of experiments. Total proteins from the homogenates and synaptosome suspension fractions were analysed by western blotting. Below: quantification of the indicated antigens extracted from hippocampal tissues of Pin1+/+ and Pin1−/− mice. All markers analysed are enriched at inhibitory synapses. Western blot to actin was done as loading control. Pin1 immunoblot indicates hyppocampus from Pin1+/+ and Pin1−/− (n=6 littermate pairs, mean values±s.d, *P<0.05, Student’s t-test) Full images of western blots are in Supplementary Fig. 5. (b) Representative confocal micrographs of frontal brain sections showing segments of the SR and SO of the CA1 region of the hippocampus from adult Pin1+/+ and Pin1−/− mice immunolabeled for gephyrin (magenta) and VGAT (green). Scale bar, 5 μm. (c) Quantification of gephyrin punctum density (normalized to 100 μm2) and their percentage of colocalization with the presynaptic marker VGAT in both mouse genotypes. (d) Confocal micrographs as in a immunolabeled for GABAA receptor γ2 subunit (green) and VGAT (magenta). (e) Quantification of γ2 subunit punctum and their percentage of colocalization with VGAT in both mouse genotypes. The number of gephyrin, γ2, gephyrin and VGAT puncta was assessed in at least eight sections for each genotypes (Pin1+/+ and Pin1−/−), by taking at least four images of SR and SO of the CA1 region of each hippocampus in each set of experiments (n=3). Mean values±s.d., *P<0.05, Student’s t-test. Scale bar, 5 μm.
Figure 6
Figure 6. Pin1 affects the amplitude but not the frequency of sIPSCs.
(a) Representative traces of sIPSCs recorded from CA1 principal cells at P11 in hippocampal slices from Pin1+/+ (black) and Pin1−/− mice (grey). Note higher amplitude events in Pin1−/− mice. (b) Each column represents the mean frequency and amplitude values of sIPSCs recorded from Pin1+/+ (black, n=9) and Pin−/− mice (grey, n=8). *P<0.05, Student’s t-test). (c) Amplitude distribution histograms of sIPSCs recorded in Pin1+/+ (1,030 events; black) and in Pin1−/− mice (1,412 events; grey). Note the appearance of a clear peak at ~200 pA in Pin1−/− mice.
Figure 7
Figure 7. Changes in amplitude of sIPSCs involve the interaction of Pin1 with NL2.
(a) Samples traces of sIPSCs recorded from hippocampal neurons in culture expressing either the NL2HA or the NL2HA-S714A mutation. (b) Amplitude and inter-event interval (IEI) plots of sIPSCs recorded in cells transfected either with the NL2HA (black; n=7) or the NL2HA-S714A point mutant (grey; n=12). P<0.05; Kolmogorov–Smirnov test. Note the shift to the right of the cumulative amplitude distribution curve obtained from cells transfected with the mutant as compared to controls.
Figure 8
Figure 8. Pin1 controls the number of active receptor channels at GABAergic synapses.
(a) Individual sIPSCs from Pin1+/+ (black) and Pin1−/− mice (grey) are shown with the average currents (thick lines). (b) Current/variance relationships for sIPSCs shown in a (c) Summary plots of weighted mean channel conductance (43±3 pS and 43±3 pS, P=0.9, Student’s t-test) and number of GABAA receptor channels (Np) in wt (black; n=8) and in Pin1−/− mice (gray; n=5). *P=0.03, Student’s t-test.
Figure 9
Figure 9. Pin1 does not affect the decay kinetics of spontaneous IPSCs.
(a) The peak amplitude of individual sIPSCs <150 pA (green) and >150 pA (blue) is plotted against their decay half-widths (τ50%) in Pin1+/+ and in Pin1−/− mice. (b) In the upper part, average traces of spontaneous IPSCs shown in a. In the lower part, average traces are normalized and superimposed. (c) Each column represents the mean 90–10% decay time constant of spontaneous IPSCs in Pin1+/+ and Pin1−/− mice, <150 pA (green), n=8 and 7, respectively and >150 pA (blue), n=6 and 7, respectively. For all comparisons, P>0.05, Student’s t-test.
Figure 10
Figure 10. Model of the putative cross-talk between proline-directed phosphorylation and tyrosine phosphorylation.
Phosphorylation of NL2 CD at S714 by a proline-directed kinase allows the recruitment of the proly isomerase Pin1. Pin1-driven conformational changes, by altering the folding of the NL2 CD, may represent the main cause responsible for gephyrin detachment (a). Alternatively, Pin1-mediated structural rearrangement may render the conserved tyrosine residue of the GBD (Y770) susceptible to phosphorylation, an event shown to prevent NL1/gephyrin interaction (b).

References

    1. Vithlani M. & Moss S. J. The role of GABAAR phosphorylation in the construction of inhibitory synapses and the efficacy of neuronal inhibition. Biochem. Soc. Trans. 37, 1355–1358 (2009). - PMC - PubMed
    1. Jacob T. C., Moss S. J. & Jurd R. GABA(A) receptor trafficking and its role in the dynamic modulation of neuronal inhibition. Nat. Rev. Neurosci. 9, 331–343 (2008). - PMC - PubMed
    1. Südhof T. C. Neuroligins and neurexins link synaptic function to cognitive disease. Nature 455, 903–911 (2008). - PMC - PubMed
    1. Levinson J. N. et al.. Neuroligins mediate excitatory and inhibitory synapse formation: involvement of PSD-95 and neurexin-1beta in neuroligin-induced synaptic specificity. J. Biol. Chem. 280, 17312–17319 (2005). - PubMed
    1. Craig A. M. & Kang Y. Neurexin-neuroligin signalling in synapse development. Curr. Opin. Neurobiol. 17, 43–52 (2007). - PMC - PubMed

Publication types

MeSH terms