. 2015 Oct;74(4):978-89.
doi: 10.1002/mrm.25473. Epub 2014 Oct 8.

Chemical shift separation with controlled aliasing for hyperpolarized (13) C metabolic imaging

Affiliations

Chemical shift separation with controlled aliasing for hyperpolarized (13) C metabolic imaging

Peter J Shin et al. Magn Reson Med. 2015 Oct.

Abstract

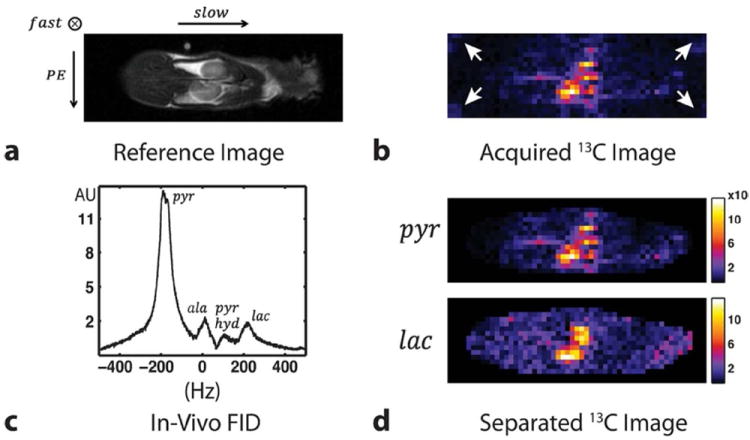
Purpose: A chemical shift separation technique for hyperpolarized (13) C metabolic imaging with high spatial and temporal resolution was developed. Specifically, a fast three-dimensional pulse sequence and a reconstruction method were implemented to acquire signals from multiple (13) C species simultaneously with subsequent separation into individual images.

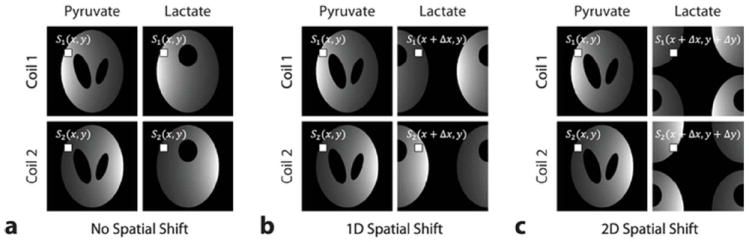
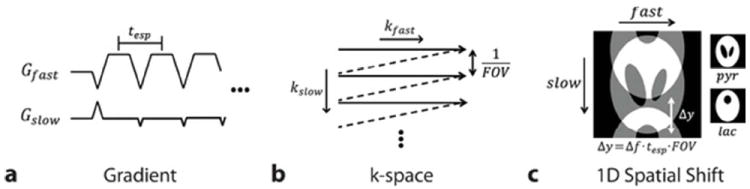
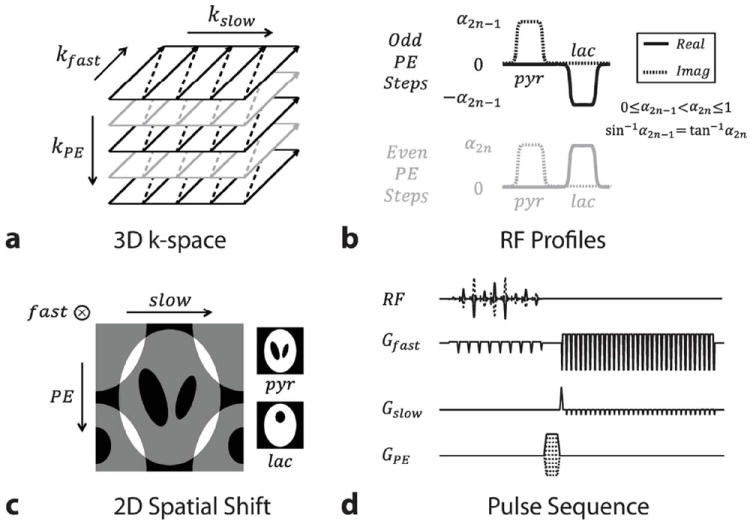
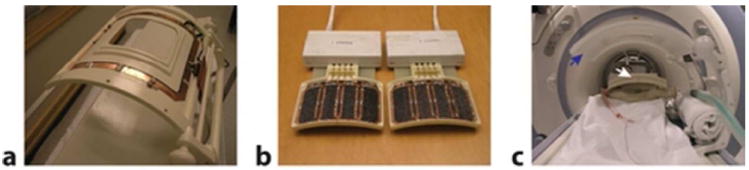
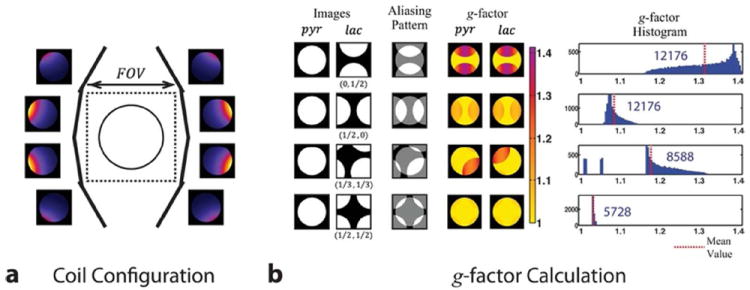
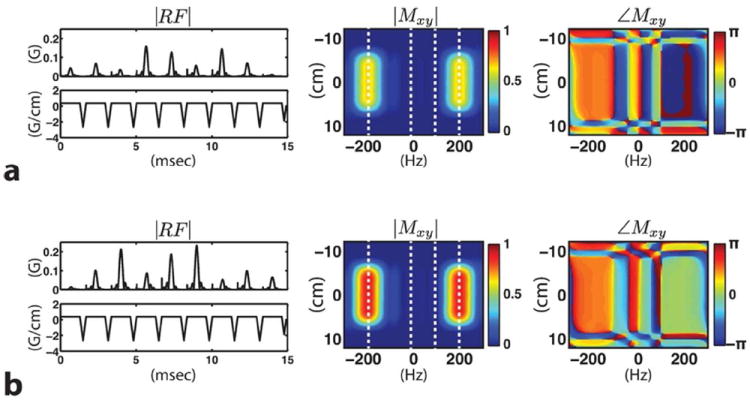
Theory and methods: A stack of flyback echo-planar imaging readouts and a set of multiband excitation radiofrequency pulses were designed to spatially modulate aliasing patterns of the acquired metabolite images, which translated the chemical shift separation problem into parallel imaging reconstruction problem. An eight-channel coil array was used for data acquisition and a parallel imaging method based on nonlinear inversion was developed to separate the aliased images.

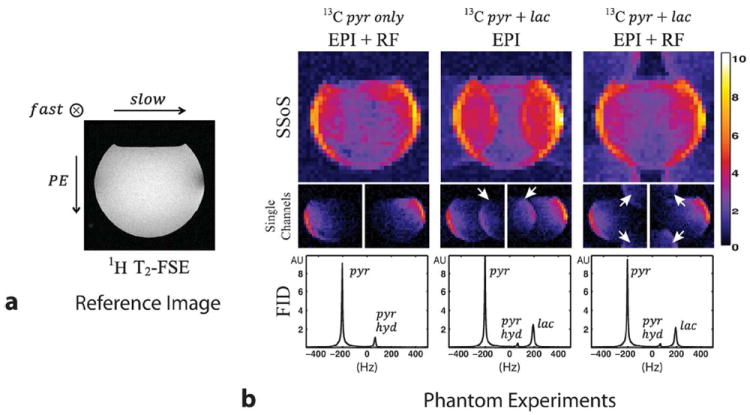
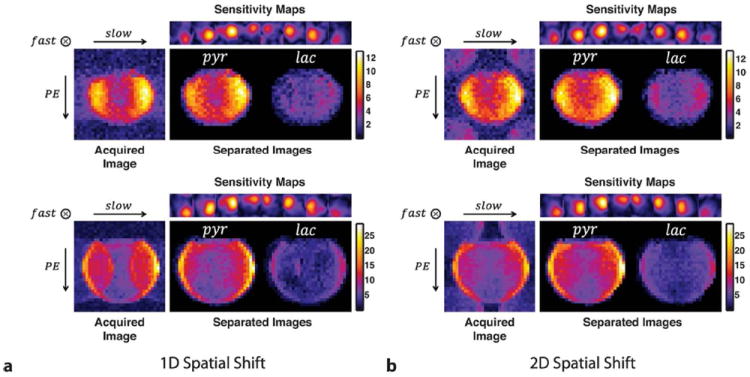
Results: Simultaneous acquisitions of pyruvate and lactate in a phantom study and in vivo rat experiments were performed. The results demonstrated successful separation of the metabolite distributions into individual images having high spatial resolution.

Conclusion: This method demonstrated the ability to provide accelerated metabolite imaging in hyperpolarized (13) C MR using multichannel coils, tailored readout, and specialized RF pulses.

Keywords: chemical shift separation; controlled aliasing; flyback EPI trajectory; hyperpolarized 13C metabolic imaging; multiband RF pulse; nonlinear inversion method.


Figures

Figure 1
Figure 1
Aliasing of sensitivity profiles in the case of two metabolite images with two receiver coils. (a) No spatial shifting, (b) 1D, and (c) 2D shifting of lactate images with respect to pyruvate images. In this example, Δx = FOVx/2 and Δy = FOVy/2.
Figure 2
Figure 2
Chemical shift displacement in flyback-EPI readout trajectory. (a) Flyback-EPI gradient waveform with tesp echo spacing. (b) Corresponding traversal trace in k-space. (c) Resultant spatial shift in the slow direction. The degree of shifting (Δy) can be adjusted by setting appropriate tesp values for a given frequency difference (Δf). Note that Δy is a cyclic shift operation in multiples of FOV.
Figure 3
Figure 3
2D chemical shift displacement. (a) 3D stack-of-EPI trajectory. (b) Lactate signal is modulated in alternating fashion at each phase encoding step. A variable flip angle scheme was also implemented by sequentially increasing excitation profiles. (c) 2D spatial shifting of lactate images (⊗ mark represents the perpendicular into-plane direction). (d) Schematic of 3D pulse sequence developed.
Figure 4
Figure 4
Coil setup used in experiments. (a) Clam shell RF transmitter. (b) Eight-channel receiver array. (c) Animal experimental setup. The white arrow points to the receiver array and the blue arrow the transmitter.
Figure 5
Figure 5
Geometry factor simulation. (a) Schematic of coil configuration with numerical phantom in the center. (b) Simulated aliasing patterns, calculated g-factors and their histograms for four cases of spatial shifting. Shifting the lactate image half the field of view in each direction resulted in the lowest g-factor values. The numbers inside the histograms represent the total number of pixels.
Figure 6
Figure 6
Two of the developed multiband excitation RF pulses shown (|RF|) with their corresponding magnitude (|Mxy|) and phase (∠Mxy) profiles. The RF pulse in (a) with 41° flip angle is followed by the one shown in (b) with 60° in the last two consecutive phase encoding steps. Starting from the left, the white dotted lines are placed on the resonant frequencies of pyruvate, alanine, pyruvate-hydrate and lactate. Excitation band is defined around the pyruvate and lactate resonance, whereas other active metabolites such as alanine and pyruvate-hydrate are not excited. Note the phase modulation applied on the lactate resonance.
Figure 7
Figure 7
Spatial shifting of lactate image with respect to pyruvate image. (a) Reference proton image acquired with a FSE sequence. (b) Square root of sum of squared phantom images (first row), two individual channel images (middle row) and FID spectrum from the entire phantom (last row) for the case of pyruvate only polarization (first column), pyruvate and lactate co-polarization with flyback EPI only acquisition (middle column) and co-polarization adopting phase modulated RF pulses together with the flyback EPI (last column). The FID spectra show that pyruvate-hydrate signal exists inside the phantom ball in each experiment. However, chemical shift artifacts that would have resulted from the hydrate signal are suppressed by adopting the multiband RF pulses. The white arrows point to the shifted lactate images.
Figure 8
Figure 8
Chemical shift separation results for (a) 1D and (b) 2D spatial shifting for two different slices. Estimated coil sensitivity profiles are also shown.
Figure 9
Figure 9
Results from in vivo rat experiment. (a) Reference proton image, (b) acquired 13C image through kidneys of the rat, (c) a FID spectrum from the entire animal and (d) separated pyruvate and lactate images. Both the pyruvate and lactate 13C signals are well localized to the kidneys. All the 13C images are combined with the square root of sum of squares method. The white arrows point to the shifted lactate images.

References

    1. Golman K, Ardenkjaer-Larsen JH, Petersson JS, Mansson S, Leunbach I. Molecular imaging with endogenous substances. Proc Natl Acad Sci USA. 2003;100:10435–10439. - PMC - PubMed
    1. Golman K, in ’t Zandt R, Thaning M. Real-time metabolic imaging. Proc Natl Acad Sci USA. 2006;103:11270–11275. - PMC - PubMed
    1. Ardenkjaer-Larsen JH, Fridlund B, Gram A, Hansson G, Hansson L, Lerche MH, Servin R, Thaning M, Golman K. Increase in signal-to-noise ratio of >10,000 times in liquid-state NMR. Proc Natl Acad Sci USA. 2003;100:10158–10163. - PMC - PubMed
    1. Chen AP, Albers MJ, Cunningham CH, Kohler SJ, Yen YF, Hurd RE, Tropp J, Bok R, Pauly JM, Nelson SJ, Kurhanewicz J, Vigneron DB. Hyperpolarized C-13 spectroscopic imaging of the TRAMP mouse at 3T-initial experience. Magn Reson Med. 2007;58:1099–1106. - PubMed
    1. Hu S, Balakrishnan A, Bok RA, Anderton B, Larson PE, Nelson SJ, Kurhanewicz J, Vigneron DB, Goga A. 13C-pyruvate imaging reveals alterations in glycolysis that precede c-myc-induced tumor formation and regression. Cell Metab. 2011;14:131–142. - PMC - PubMed

Publication types