

Splash dispersal of Phyllosticta citricarpa conidia from infected citrus fruit
- PMID: 25298272
- PMCID: PMC4190508
- DOI: 10.1038/srep06568
Splash dispersal of Phyllosticta citricarpa conidia from infected citrus fruit
Abstract
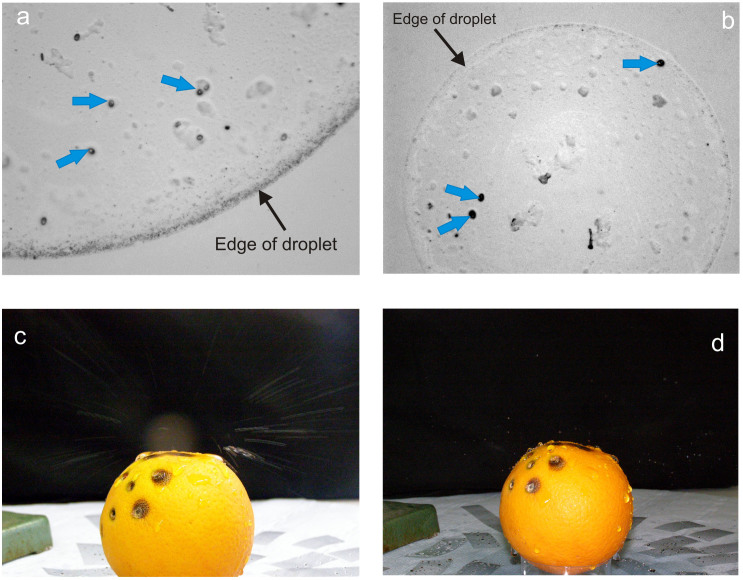
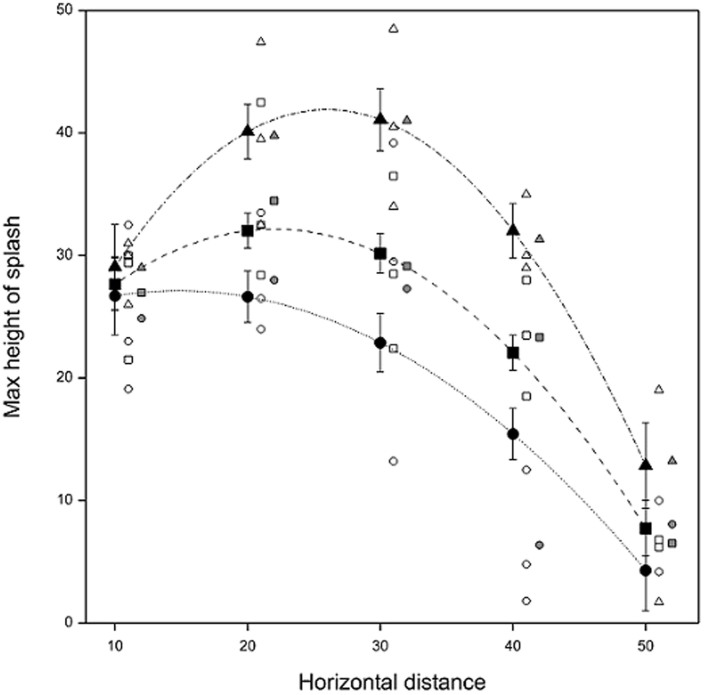
Rain-splash dispersal of Phyllosticta citricarpa (syn. Guignardia citricarpa) conidia (pycnidiospores) from infected oranges was studied in still air and combined with wind. High power microscopy demonstrated the presence of conidia in splash droplets from diseased oranges, which exuded conidia for over one hour during repeated wetting. The largest (5 mm) incident drops produced the highest splashes (up to 41.0 cm). A linear-by-quadratic surface model predicted highest splashes to be 41.91 cm at a horizontal distance of 25.97 cm from the target orange. Large splash droplets contained most conidia (4-5.5 mm splashes averaged 308 conidia), but were splashed <30 cm horizontal distance. Most (80-90%) splashes were <1 mm diameter but carried only 0-4 conidia per droplet. In multiple splash experiments, splashes combined to reach higher maxima (up to 61.7 cm; linear-by-quadratic surface model prediction, 62.1 cm) than in the single splash experiments. In combination with wind, higher wind speeds carried an increasing proportion of splashes downwind travelling horizontally at least 8 m at the highest wind speed tested (7 m/s), due to a small proportion of droplets (<1 mm) being aerosolised. These experiments suggest that P. citricarpa conidia can be dispersed from infected oranges by splashes of water in rainfall events.
Figures
References
-
- Aa van der H. A. Studies in Phyllosticta I. Stud Mycol 5, 1–110 (1973).
-
- Kiely T. B. Preliminary studies on Guignardia citricarpa, n. sp.: The ascigenous stage of Phoma citricarpa McAlp. and its relation to black spot of citrus. Proc Linnean Soc N S Wales 68, 249–292 (1948).
-
- Paul I., van Jaarsveld A. S., Korsten L. & Hattingh V. The potential global geographical distribution of Citrus Black Spot caused by Guignardia citricarpa Kiely: The likelihood of disease establishment in the European Union. Crop Prot 24, 297–308 (2005).
-
- E F. S. A. Scientific opinion of the panel on plant health on a request from the European Commission on Guignardia citricarpa Kiely. EFSA J 925, 1–108 (2008).
-
- E F. S. A. Scientific opinion on the risk of Phyllosticta citricarpa (Guignardia citricarpa) for the EU territory with identification and evaluation of risk reduction options. EFSA J 12 (2), 3557 [243 pp.]. 10.2903/j.efsa.2014.3557 (2014).
Publication types
MeSH terms
Grants and funding
LinkOut - more resources
Full Text Sources
Other Literature Sources
Miscellaneous
