

A model for sigma factor competition in bacterial cells
- PMID: 25299042
- PMCID: PMC4191881
- DOI: 10.1371/journal.pcbi.1003845
A model for sigma factor competition in bacterial cells
Abstract
Sigma factors control global switches of the genetic expression program in bacteria. Different sigma factors compete for binding to a limited pool of RNA polymerase (RNAP) core enzymes, providing a mechanism for cross-talk between genes or gene classes via the sharing of expression machinery. To analyze the contribution of sigma factor competition to global changes in gene expression, we develop a theoretical model that describes binding between sigma factors and core RNAP, transcription, non-specific binding to DNA and the modulation of the availability of the molecular components. The model is validated by comparison with in vitro competition experiments, with which excellent agreement is found. Transcription is affected via the modulation of the concentrations of the different types of holoenzymes, so saturated promoters are only weakly affected by sigma factor competition. However, in case of overlapping promoters or promoters recognized by two types of sigma factors, we find that even saturated promoters are strongly affected. Active transcription effectively lowers the affinity between the sigma factor driving it and the core RNAP, resulting in complex cross-talk effects. Sigma factor competition is not strongly affected by non-specific binding of core RNAPs, sigma factors and holoenzymes to DNA. Finally, we analyze the role of increased core RNAP availability upon the shut-down of ribosomal RNA transcription during the stringent response. We find that passive up-regulation of alternative sigma-dependent transcription is not only possible, but also displays hypersensitivity based on the sigma factor competition. Our theoretical analysis thus provides support for a significant role of passive control during that global switch of the gene expression program.
Conflict of interest statement
The authors have declared that no competing interests exist.
Figures

 and a generic alternative sigma factor
  : the model describes binding of
  or
or  to core RNA polymerase (
 ) to form holoenzymes (
 and
and  ) as well as transcription (promoter binding, transcription initiation and elongation) of the cognate genes and non-specific binding of holoenzymes and core RNAPs to DNA. (B) Core model for holoenzyme formation.
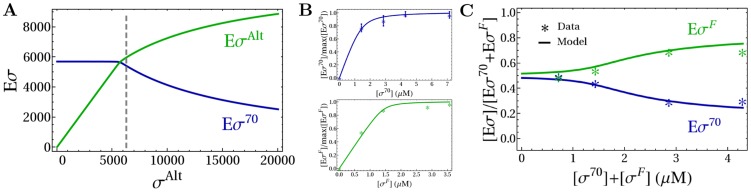
 and
and  as a function of the copy number of alternative sigma factors. Quantities of all molecular species are expressed as absolute numbers per cell. The gray dashed line represents the onset of the competition, when
  . The values of the parameters used in the simulations are summarized in Table 1. (B) Determination of the sigma-core dissociation constants for
  and
and  (see Table 2) by fitting the results of binding assays between cores and sigma factors , . The number of core-sigma complexes normalized to the maximal number of holoenzymes,
  . Stars show the experimental data and lines are due to the fit. (C) Comparison of model predictions (lines) with an in vitro competition experiment with a fixed amount of core and different equimolar amounts of
  and
and  (stars) in the same conditions as in (B). The plot shows the fraction of sigma factors bound in holoenzymes as a function of the total sigma factor concentration,
  .
.
 (Equation 12) for a σ
70-dependent promoter as a function of the number of alternative sigma factors. The numbers of
(Equation 12) for a σ
70-dependent promoter as a function of the number of alternative sigma factors. The numbers of  and cores are fixed. The blue line is for a saturated promoter (with
  M) and the cyan line for an unsaturated promoter (with
  M). (B) Comparison of model predictions (lines) with an in vitro competition experiment with a fixed amount of core and σH and different amounts of
  (stars). The plot shows the transcription rate of a σH-dependent gene (normalized to the maximal value) as a function of the concentration
  . (C) The sigma-core and the holoenzyme-promoter dissociation constants (see Table 2) are determined by fitting the results of transcription rate experiments with a fixed amount of cores in the same conditions as in (B) without competition in the presence of a DNA template containing σH- and σ
70-driven genes , . (D) When a σ
70-dependent promoter also binds another type of holoenzyme or overlaps to another promoter,
. (C) The sigma-core and the holoenzyme-promoter dissociation constants (see Table 2) are determined by fitting the results of transcription rate experiments with a fixed amount of cores in the same conditions as in (B) without competition in the presence of a DNA template containing σH- and σ
70-driven genes , . (D) When a σ
70-dependent promoter also binds another type of holoenzyme or overlaps to another promoter,  also acts as a repressor of the σ
70-dependent transcription. (E) Normalized transcription rate of a saturated and unsaturated σ
70-dependent promoter as a function of the number of
also acts as a repressor of the σ
70-dependent transcription. (E) Normalized transcription rate of a saturated and unsaturated σ
70-dependent promoter as a function of the number of  (blue and cyan solid lines with
  M and
M and  M, respectively). The dashed line show the corresponding results in the absence of repression by promoter sharing or overlapping.
 M, dotted line) and with different non-specific binding affinities (
 M,
M,  M, solid line). (B) Number of free cytoplasmic holoenzymes
  and
and  (upper row) and total number of holoenzymes (free and non-specifically bound,
  , lower row) as functions of the copy number of alternative sigma factors for three different combinations of non-specific binding affinities: in (i) and (ii) all non-specific dissociation constant are equal (
 M), in (iii) and (iv) the non-specific dissociation constant for the core is smaller than for the holoenzymes (
 M,
M,  M), in (v) and (vi) the non-specific dissociation constant for the
  is smaller than for
  and core (
 M,
M,  M). The dashed lines in all panels shows the reference case without DNA (no non-specific binding).
 nM, dashed line), in the presence of specific binding (holoenzymes bind to promoter with
  M but do not transcribe, case (i)) and in the presence of both specific binding and transcription (case (ii)). The black bars (
 ) show the case when sigma factor and core unbind as holoenzyme (the binding affinity is described by the equilibrium dissociation constant), the dark blue (
 ) and the light blue bars (
 ) when sigma factor separates from core either after promoter unbinding or gene transcription and after 300 nucleotides, respectively (thus, the binding affinity is
  ). (C) Number of holoenzymes
  and
and  as a function of the copy number of alternative sigma factors in the absence of DNA (case (i)), with transcription of both σ
70- and σAlt-dependent genes but with unbinding of sigma factor after 300 nucleotides and core at the end of the operon (case (ii)) and only with the transcription of the σAlt-dependent genes (case (iii)). Values of the parameters are the same as in Figure 5B. (D) Formation of holoenzymes
as a function of the copy number of alternative sigma factors in the absence of DNA (case (i)), with transcription of both σ
70- and σAlt-dependent genes but with unbinding of sigma factor after 300 nucleotides and core at the end of the operon (case (ii)) and only with the transcription of the σAlt-dependent genes (case (iii)). Values of the parameters are the same as in Figure 5B. (D) Formation of holoenzymes  and
and  as a function of the copy number of alternative sigma factors without DNA (dashed lines) and transcript elongation (solid lines). (E) Modulation of the effective binding affinities
  by sigma factor competition related to the case of Figure 5D. (F) Normalized transcription rate for σ
70- and σAlt-dependent promoters as a function of the number of alternative sigma factors, related to the case of Figure 5D (with
by sigma factor competition related to the case of Figure 5D. (F) Normalized transcription rate for σ
70- and σAlt-dependent promoters as a function of the number of alternative sigma factors, related to the case of Figure 5D (with  nM and
  nM).
nM).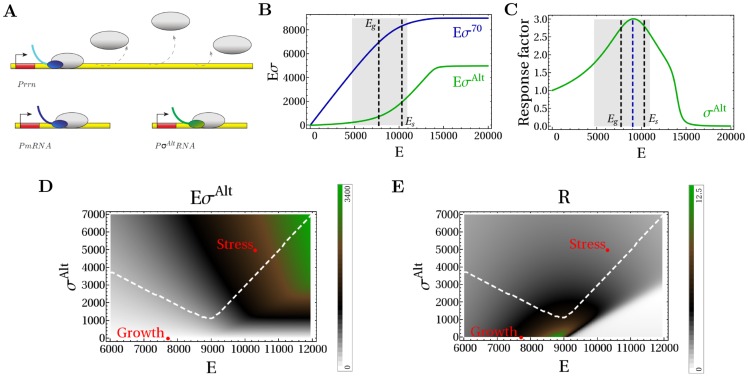
 and
and  as a function of the copy number of core RNAPs. The black dashed lines show the number of available RNAPs during the exponential growth state (
 ) and during the stringent response state. The gray region shows the range of core RNAP for which there is sigma factor competition. (C) Response factor
  of the alternative sigma factor-dependent gene transcription (with
  M) to an increase of concentration of RNAPs. The blue dashed line shows the maximal sensitivity, that for strong core-sigma binding, is found for
  and lies in the competition region. (D) Number of alternative holoenzymes and (E) response factor
  related to the σAlt-dependent gene transcription as a function of the number of core RNAPs and alternative sigma factors (with
  M). The white line encloses the region of sigma factor competition. The points show possible values of cores and alternative sigma factors for a cell in the exponential growth state and in the stringent state.
Similar articles
-
Effects of σ factor competition are promoter initiation kinetics dependent.Biochim Biophys Acta. 2016 Oct;1859(10):1281-8. doi: 10.1016/j.bbagrm.2016.07.011. Epub 2016 Jul 21. Biochim Biophys Acta. 2016. PMID: 27452766
-
Regulation of alternative sigma factor use.Annu Rev Microbiol. 2011;65:37-55. doi: 10.1146/annurev.micro.112408.134219. Annu Rev Microbiol. 2011. PMID: 21639785 Review.
-
Where to begin? Sigma factors and the selectivity of transcription initiation in bacteria.Mol Microbiol. 2019 Aug;112(2):335-347. doi: 10.1111/mmi.14309. Epub 2019 Jun 3. Mol Microbiol. 2019. PMID: 31119812 Free PMC article. Review.
-
The P1 promoter of the Escherichia coli rpoH gene is utilized by sigma 70 -RNAP or sigma s -RNAP depending on growth phase.FEMS Microbiol Lett. 2009 Feb;291(1):65-72. doi: 10.1111/j.1574-6968.2008.01436.x. Epub 2008 Dec 3. FEMS Microbiol Lett. 2009. PMID: 19076234
-
Sigma and RNA polymerase: an on-again, off-again relationship?Mol Cell. 2005 Nov 11;20(3):335-45. doi: 10.1016/j.molcel.2005.10.015. Mol Cell. 2005. PMID: 16285916 Review.
Cited by
-
Engineering strong and stress-responsive promoters in Bacillus subtilis by interlocking sigma factor binding motifs.Synth Syst Biotechnol. 2019 Nov 8;4(4):197-203. doi: 10.1016/j.synbio.2019.10.004. eCollection 2019 Dec. Synth Syst Biotechnol. 2019. PMID: 31750410 Free PMC article.
-
Diversity, versatility and complexity of bacterial gene regulation mechanisms: opportunities and drawbacks for applications in synthetic biology.FEMS Microbiol Rev. 2019 May 1;43(3):304-339. doi: 10.1093/femsre/fuz001. FEMS Microbiol Rev. 2019. PMID: 30721976 Free PMC article. Review.
-
Interactions between DksA and Stress-Responsive Alternative Sigma Factors Control Inorganic Polyphosphate Accumulation in Escherichia coli.J Bacteriol. 2020 Jun 25;202(14):e00133-20. doi: 10.1128/JB.00133-20. Print 2020 Jun 25. J Bacteriol. 2020. PMID: 32341074 Free PMC article.
-
Atlas: automatic modeling of regulation of bacterial gene expression and metabolism using rule-based languages.Bioinformatics. 2021 Apr 1;36(22-23):5473-5480. doi: 10.1093/bioinformatics/btaa1040. Bioinformatics. 2021. PMID: 33367504 Free PMC article.
-
Bimodality in E. coli gene expression: Sources and robustness to genome-wide stresses.PLoS Comput Biol. 2025 Feb 13;21(2):e1012817. doi: 10.1371/journal.pcbi.1012817. eCollection 2025 Feb. PLoS Comput Biol. 2025. PMID: 39946496 Free PMC article.
References
MeSH terms
Substances
LinkOut - more resources
Full Text Sources
Other Literature Sources
